BTC-TCs After the Pullback: Where mNAV Meets Opportunity

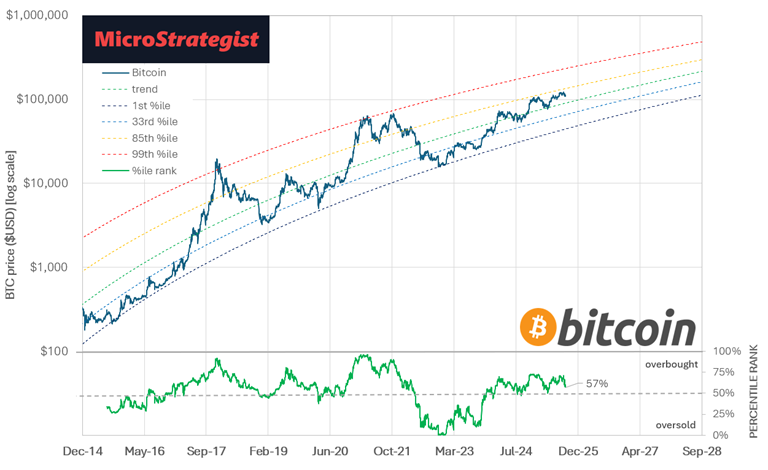
· Bitcoin has cooled from ~$124k to ~$107k, but still sits just above its long-term power-law trend (57th percentile).
· Our models (M2 + hash rate + S&P) point to a ~$122k as a current “fair value” for BTC vs. broader markets.
· The June pivot aligned with a sharp ETH/BTC upswing; hot money rotated to ETH-treasuries, but BTC-TC fundamentals remain intact.
· Most BTC-TCs have retraced hard (many >50%), pushing mNAVs lower and opening selective buy-the-dip windows—if stacking momentum persists.
Blood In the Streets
The Bitcoin world has been a little bumpy lately, but the BTC-TC space has been a rollercoaster, with many pulling back more than 50% from their highs.

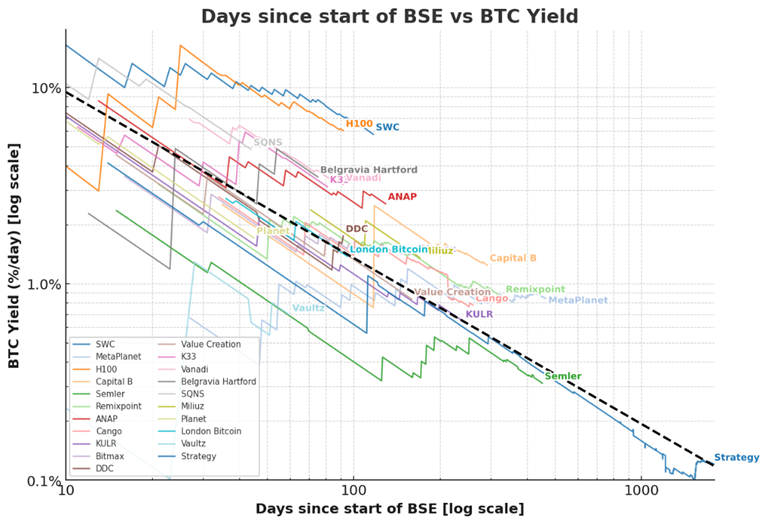
For fun this week, I plotted the BTC yield vs. mNAV for all the BTC-TC companies we’re tracking. As you can see, most of them have fallen way below the trend line of where they should be based on their current size and yield.
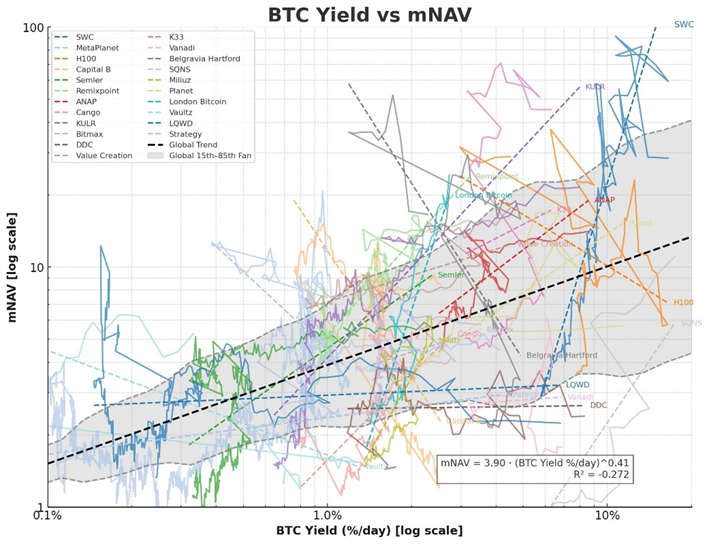
As a general rule, BTC-TCs that burst out of the gates the fastest, with the highest BTC Yield and mNAV, have fallen the furthest and fastest.
While the BTC-TC space may become more competitive in the future, without the sky-high mNAVs seen earlier this year, there are likely to be some great buying opportunities emerging in the next few weeks and months for those who are patient and let the market come to them.
Choose Your Lane: Conservative / Balanced / Aggressive
In last week’s article, "A Quantitative Playbook for Investing in Bitcoin Treasury Companies," we examined how our BTC-TC portfolio allocation system operates.
In this week’s update, we’ll be delving into the details of each of the companies we’re tracking to identify optimal prices to buy on the dip (if you’re that way inclined).
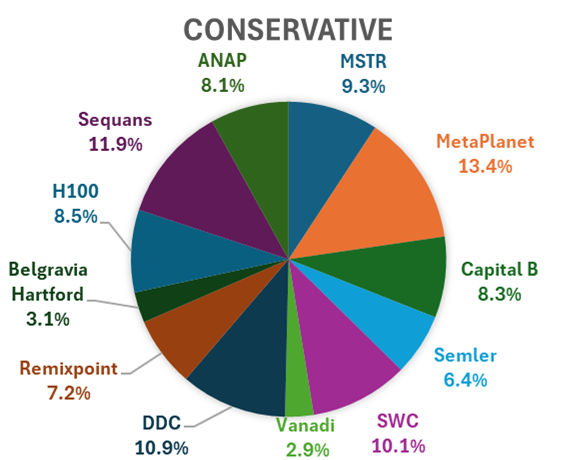
Conservative Bucket — Steady Compounders
The conservative portfolio focuses on companies such as MetaPlanet, Strategy, Capital B, and SWC, which have a longer history of consistent returns.
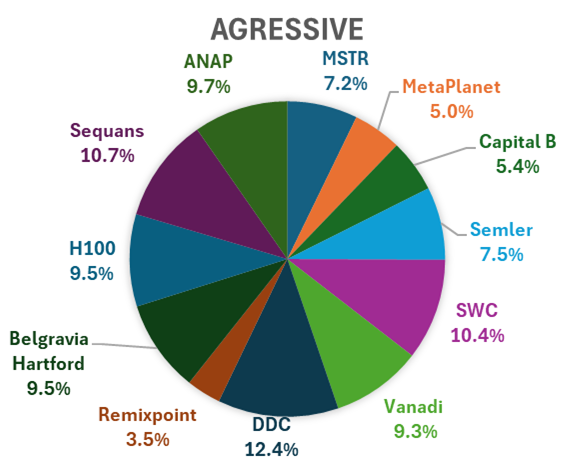
Aggressive – High-Torque Stackers
Meanwhile, the aggressive portfolio focuses on smaller companies that have been growing rapidly from a lower base, such as H100, Vanadi, DDC, and Belgravia Hartford.
Balanced = The Middle Path
Finally, the balanced portfolio strikes a balance between the two extremes.
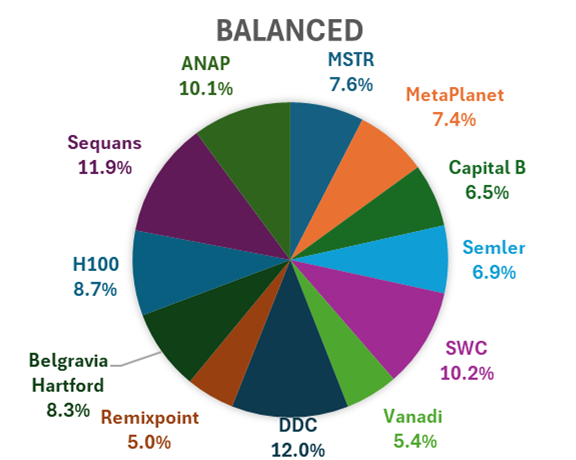
We’ll dive into the charts for each of these, but first, let’s look at the big picture of Bitcoin.
Tape Check: BTC in Context
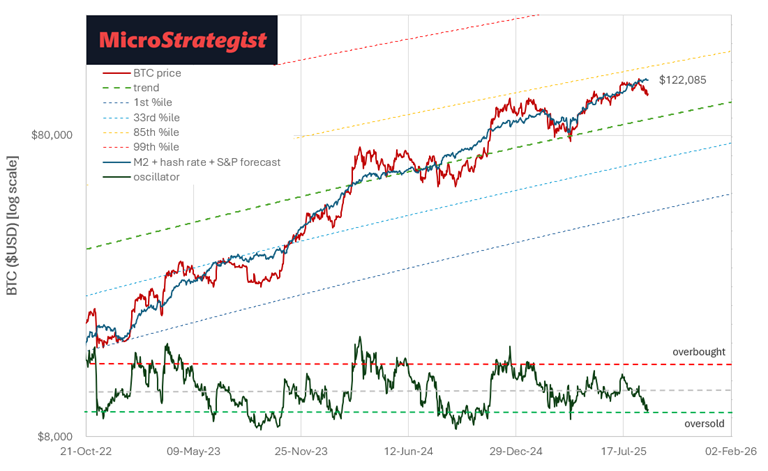
We’ve seen a bit more volatility lately, with Bitcoin pulling back from its high of $124k (14 Aug) to $107k (30 Aug) amid fears of a slowing US economy. Currently, we’re positioned just above the power law trend line at the 57th percentile.
Volatility Watch
After drifting to record-low volatility levels recently, Bitcoin has experienced a slight increase in downside volatility, as investors feared what Powell might say at the Jackson Hole meeting.
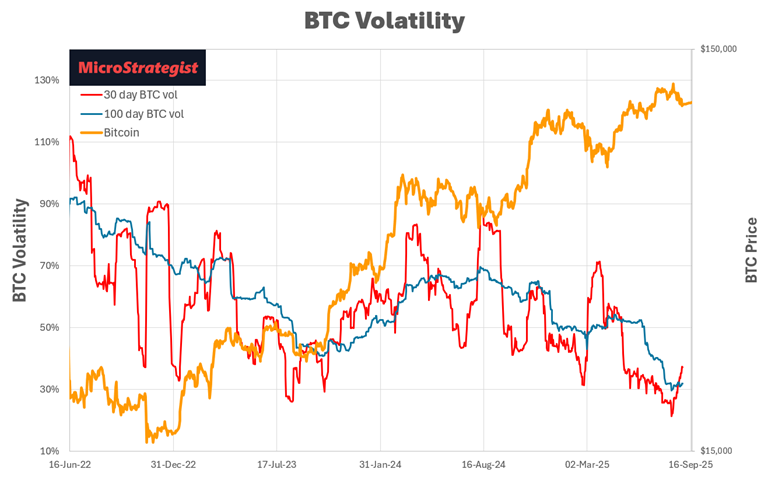
We really have no way of knowing where Bitcoin is headed in the short term. Still, there’s a high probability that, unless all governments become fiscally responsible, Bitcoin will continue to rise over the long term as more people realise their money is losing value in the fullness of time.

While downside volatility isn’t fun to live through, a quiet period followed by a sharp pullback to clear leveraged long positions often precedes the next rally.
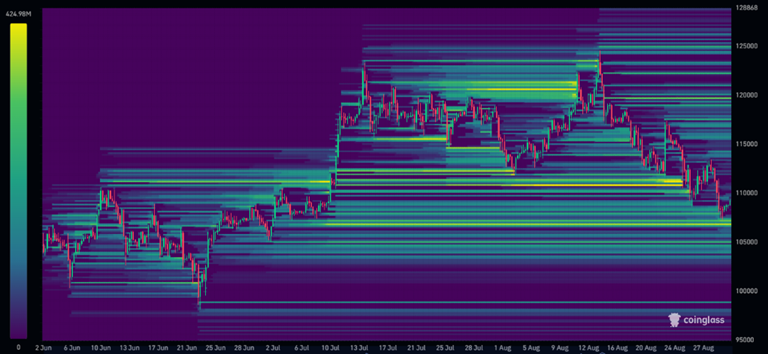
The liquidation heatmap from CoinGlass indicates that a significant number of leveraged long positions have been cleared over the past few weeks. We could still see a quick dip down to $106k in the coming weeks to clear more leverage before heading up again.
Macro Scorecard: M2 • Hash • S&P
Our M2 + hash rate + S&P model suggests that Bitcoin is currently oversold relative to the broader market, with a fair value of around $122k based on this model. With a lot hinging on future US rate cuts, investors are likely holding back on Bitcoin as a higher-risk asset until the future direction is clearer.
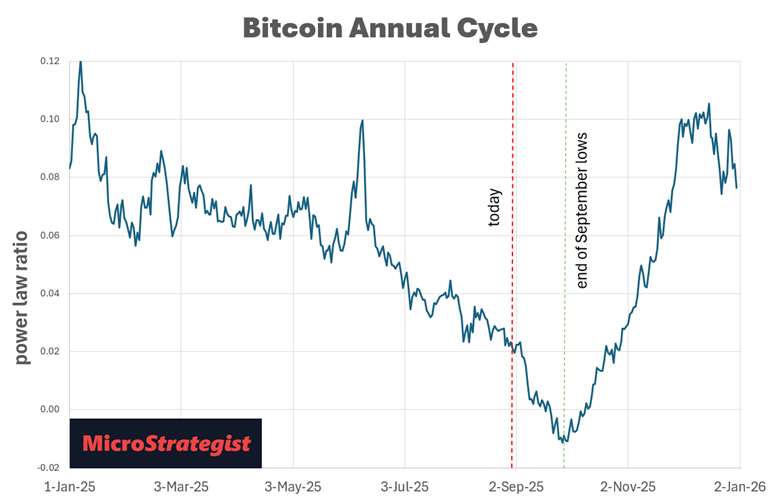
September Drag → Uptober?
If Bitcoin follows its typical “sell in May and go away” cycle, it could have a bit further to fall before Uptober comes. Some are saying we’re seeing the September lows early. But only time will tell.
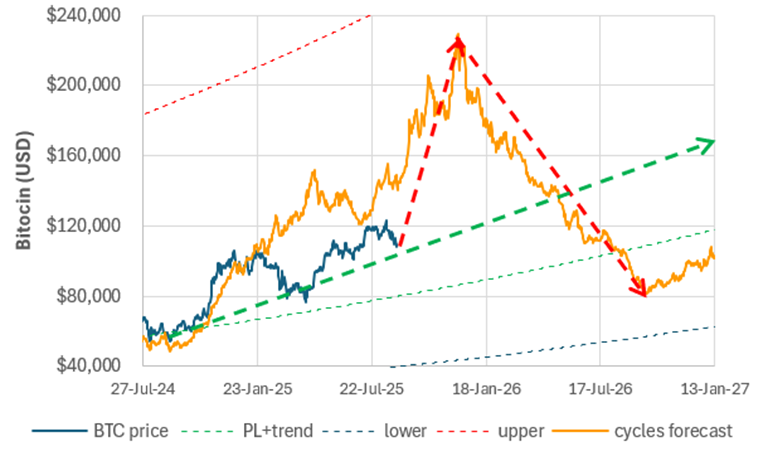
Four-Year Cycle vs Supercycle
If Bitcoin were following its historical halving and election cycle, we might be expecting a peak at $230k in early December. If this does happen, we would need to be prepared for a big dump on the other side. However, this cycle appears more likely to continue its slow grind upwards, so long as liquidity persists.
Now that the broader context is out of the way, let's delve into a long-overdue analysis of the individual BTC-TCs in the portfolios. We’re working on automating these on our new website, but until then, we’ll publish regular updates of these charts going forward.
BTC-TC Overview & Rotation
Bitcoin Treasuries were all running hot until mid-June, when they collectively pulled back. Shout out to Mark Moss for pointing out that the top for many of the BTC-TCs coincided with a massive upswing in the ETH/BTC ratio (as shown in the chart below). It seems that a lot of the hot money went chasing the new Ethereum treasury companies (like Bitmine).
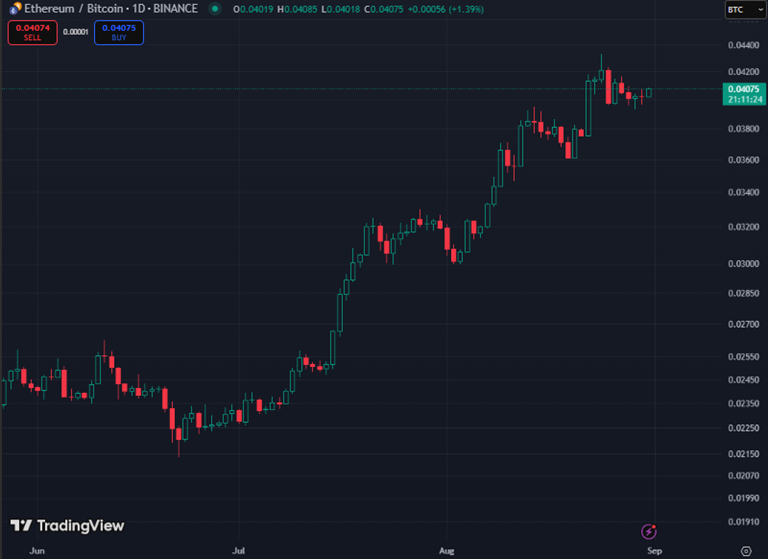
As you see, though, the fundamentals for the BTC-TCs are still in place (i.e. grow BTC/share + BTC NGU), and there’s a good chance they should bounce back once Bitcoin makes its next move up, so long as they keep stacking Bitcoin. With many of them trading at very low mNAVs, there’s a lot less risk and more upside going forward.
Stack Speed vs Staying Power
Our first chart provides an overview of the forecasted CAGR of BTC, along with a shortlist of BTC-TCs in our portfolio. It’s a bit messy, but this new chart is potentially super helpful in identifying how BTC-TCs might perform over the coming couple of years based on their current stacking trajectory.
· At the base of the chart, we have Bitcoin with a stable CAGR of 30% p.a. based on the current power law growth.
· Above that, we have Strategy, which is forecast to grow at 83% p.a. in the short term, diminishing to 70% p.a. over the next two years.
· At the top of the chart, we have DDC, Sequans, H100, and Belgravia Hartford, which are the current rockets stacking hard and fast from a much lower base.
· Meanwhile, MetaPlanet has the highest projected two-year returns.
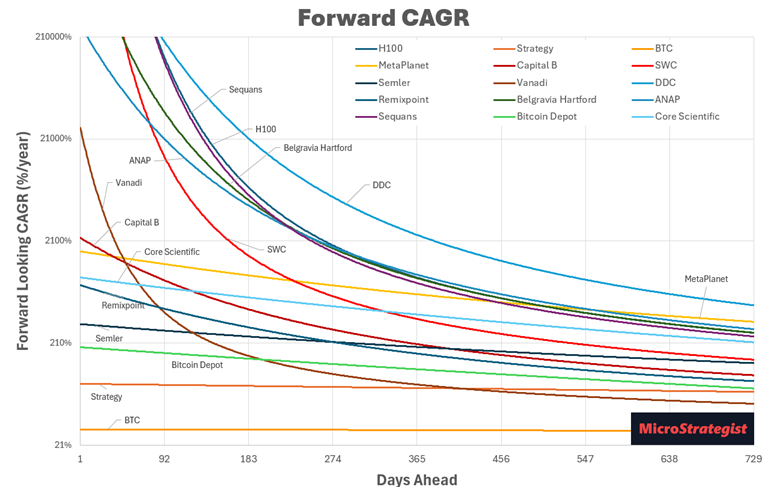
Companies that rapidly grow their BTC stack are unlikely to sustain that growth in the long term, so they dip earlier. Meanwhile, larger companies that have been consistently increasing for longer have a better chance of maintaining their growth in the long term.
While there’s no guarantee we’ll see these precise returns (some of them are HUGE!), this chart gives us an idea of which companies are destined to be the short-term rockets and which ones are the stable workhorses of the BTC-TC ecosystem.
BTC Yield × mNAV Bubble Map
Our bubble chart remains dynamic. With a few of the BTC-TCs dropping below an mNAV of 1, I’ve had to adjust the scale slightly. Take note of both DDC and Sequens, which are deep in the buy zone with aggressive stacking and low mNAV.
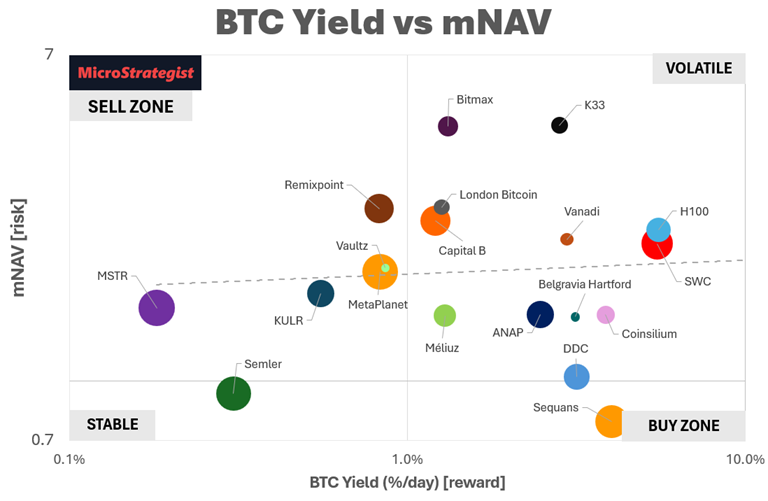
One thing to keep in mind with this chart, though, is that it doesn’t identify which companies are likely to see their yield shrink more quickly; that’s where the s-curve regressions, which we’ll cover below, become important.
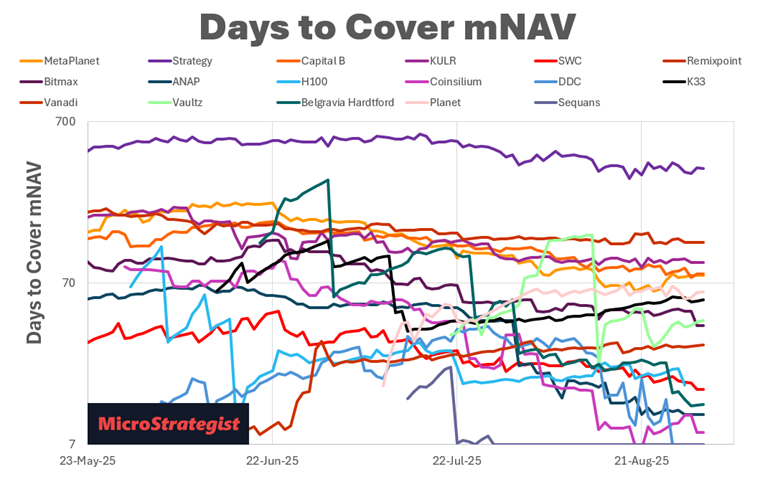
Days to Cover mNAV Premium
The DTC mNAV chart combines the BTC Yield and mNAV into a single metric. Notice how many of the BTC-TCs have come off their 22 June peaks.
Strategy — Preferreds as Stack Engine
While Strategy is currently back to where it was in November, and sentiment on X is negative, the long-term trajectory looks promising. It’s currently sitting at the 40th percentile of its long-term fair value range.
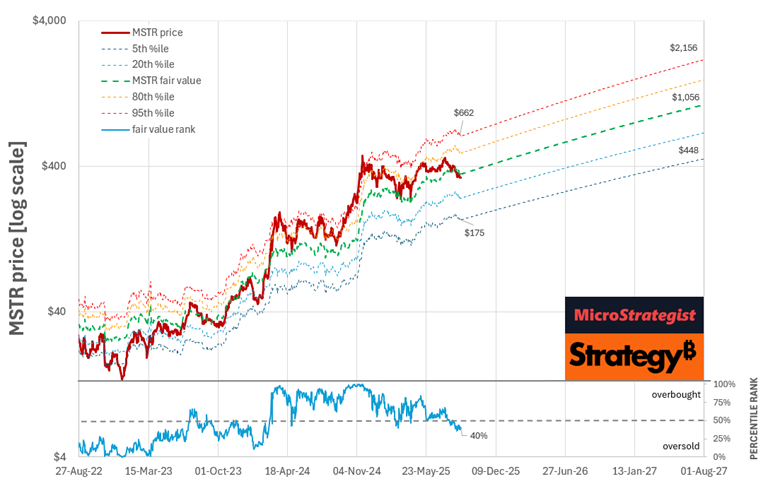
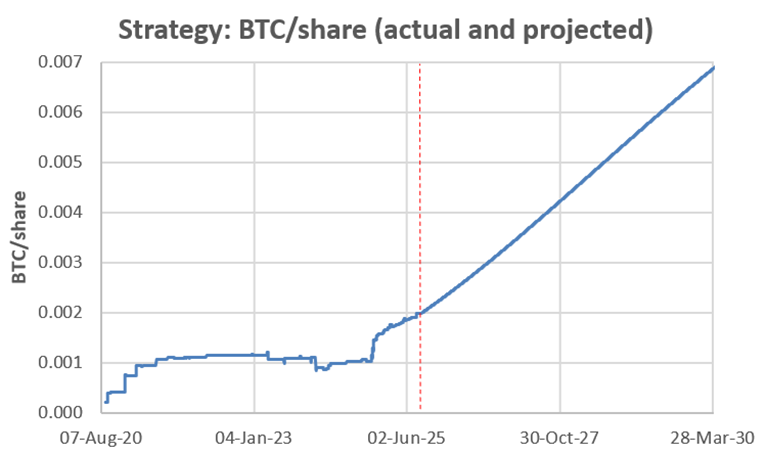
Their BTC accumulation hasn’t exactly been smooth over the long term, as they’ve trialled different approaches to fuel their growth, but the long-term S-curve has them heading up and to the right for a very long time.
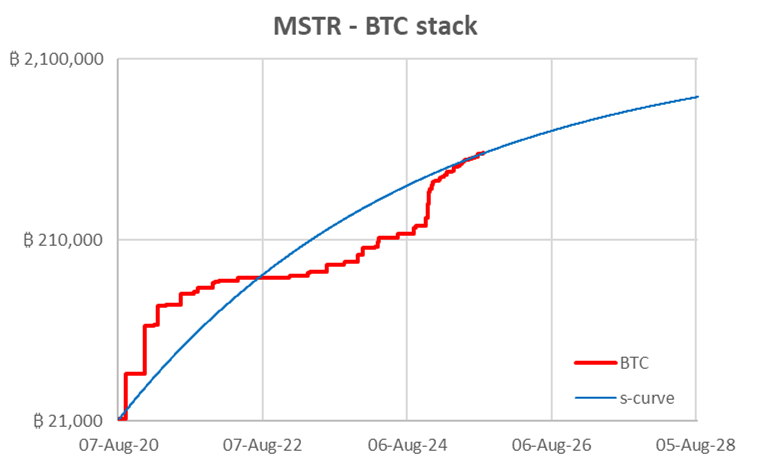
To continue their current growth trajectory, they need to buy 587 BTC every day!
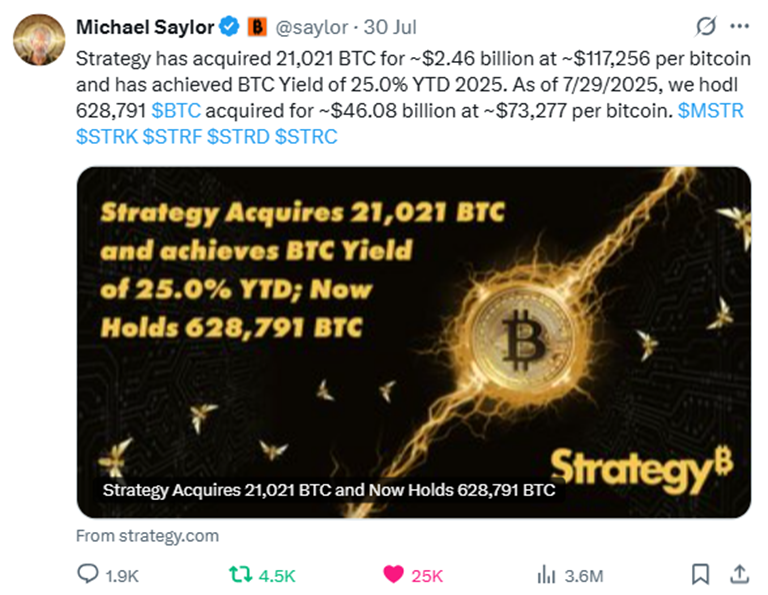
If we zoom in on their recent growth, we can see a significant jump on 30 July 2025, followed by little movement since then.
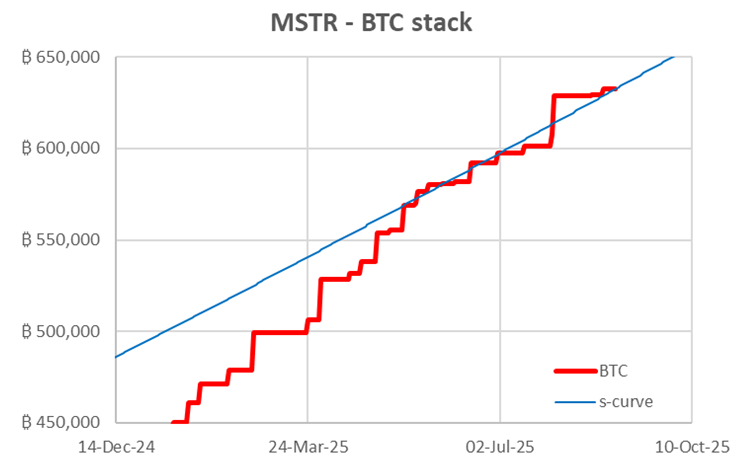
At the end of July, Strategy purchased 21,021 BTC with the proceeds of their STRC launch.
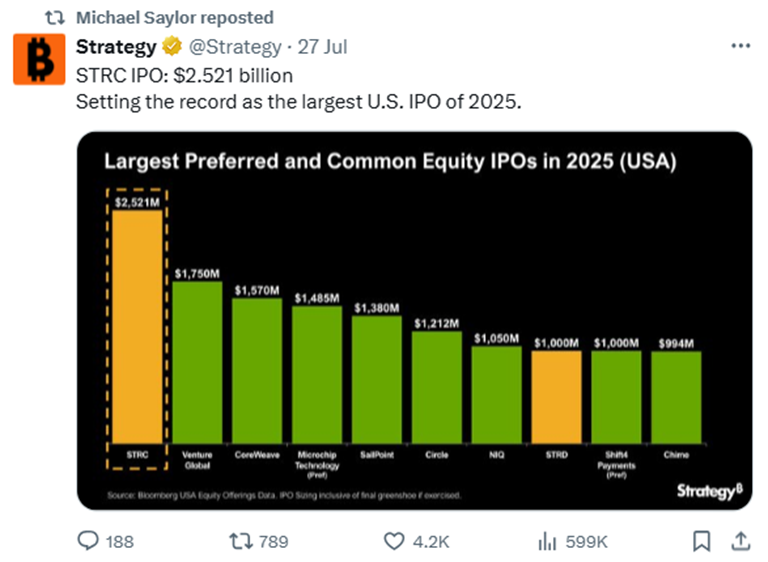
At $2.521b, this was the largest IPO of 2025.
However, with an IPO price of $90, we now have $2.5 billion of equity willing to sell if STRC is above $90 for a quick profit, and Strategy can’t really start hammering the ATM on it until it exceeds $100.
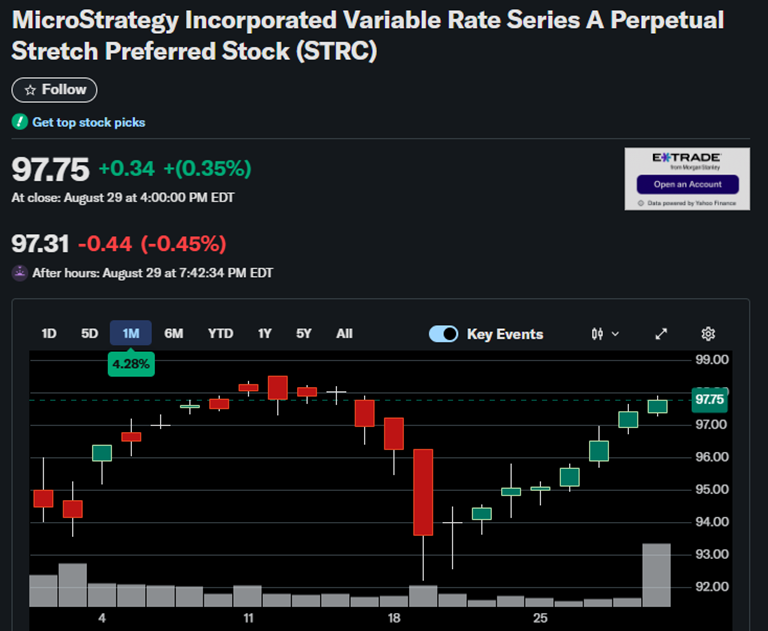
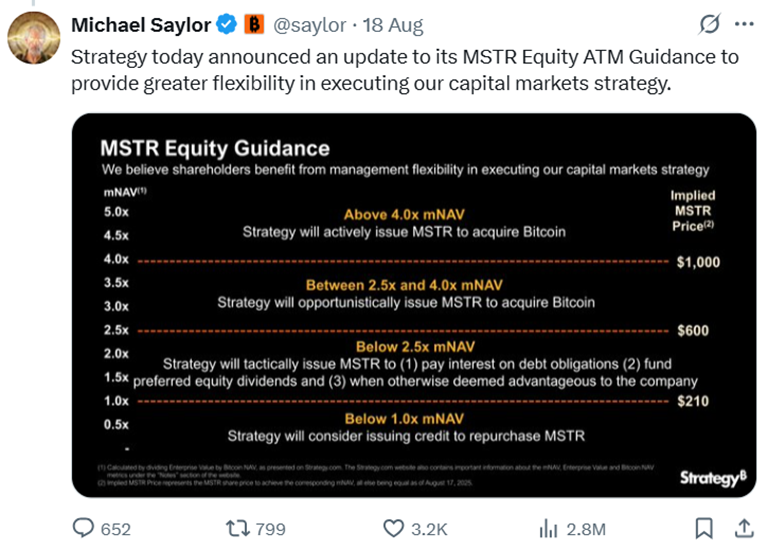
This is not great in the short term, as Strategy is unable to raise funds to buy more BTC. Until the preferreds start trending up, without the common stock ATM, they’re effectively dead in the water. This is likely why they published revised guidance on their common stock ATM limits, reinstating the ATM below an mNAV of 2.5.
Hopefully, in the medium term, the preferreds will perform well, allowing them to reduce their reliance on the ATM for the common MSTR stock. STRC appears to have bottomed out on 19 August and is now nearly at par, meaning they will be able to rely on the preferreds more and more to raise capital.
I think there’s a strong chance that a 9% p.a. risk-free yield will be highly attractive to many people, which will enable Strategy to harvest the premium via ATM on STRC and lay off the common stock in the medium term, especially if they secure S&P 500 inclusion this round.
Saylor recently said that he would like to see volatility come back to the common stock, so I wouldn’t be surprised if this is all part of their grand plan to go hard with the STRC IPO, followed by a pause in buying BTC where everyone think they’re dying and shorts them, with a rip with S&P inclusion and the next rip in BTC (whenever that is).
While many people seem to be waiting for mNAV to rise again, the reality is that now they have such a high BTC stack, the days of high mNAV are likely behind them. The BTC Yield and, hence, mNAV will trend downward over the long term.
But what matters is that they continue to stack and build BTC per share. As long as the preferreds allow them to continue buying BTC at a similar rate as before (that’s the $100 billion question), Strategy should be just fine for the long term. In the fullness of time, the companies with the biggest BTC stacks will win the game, and Strategy is already in an uncatchable position.
While MSTR won’t run as fast as some of the smaller BTC-TCs, our modelling suggests that, if it can maintain the current stacking trajectory, it should yield about twice the returns of BTC, which is the overall goal.
MetaPlanet — Discipline Over Speed
Back in early June, we highlighted that MetaPlanet was hitting the top of its fair value range and might be headed for a reversal. Well, the reversal has now happened.
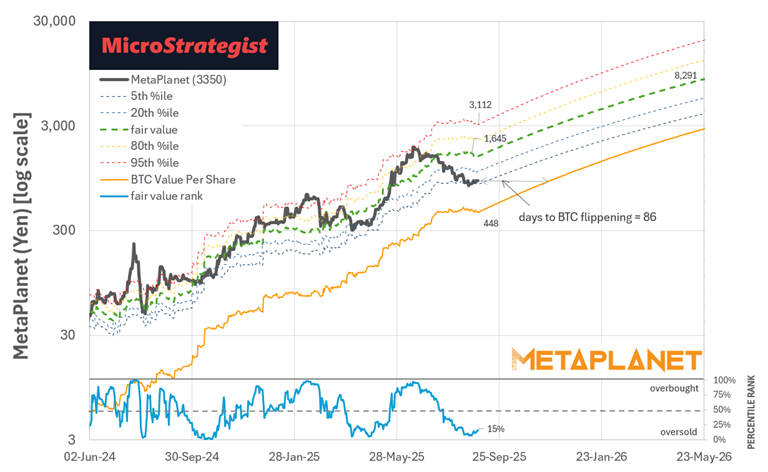
A week ago, MetaPlanet was down to the 7th percentile, but has now risen to the 15th percentile and 87 days until the value of its BTC per share flips its current price. If you believe that MetaPlanet can continue the trajectory of the past, they’re looking like a bargain at current prices!
While their BTC stacking has slowed during the recent reversal as they’re unable to use the ATM, their long-term trajectory is exceptionally healthy.
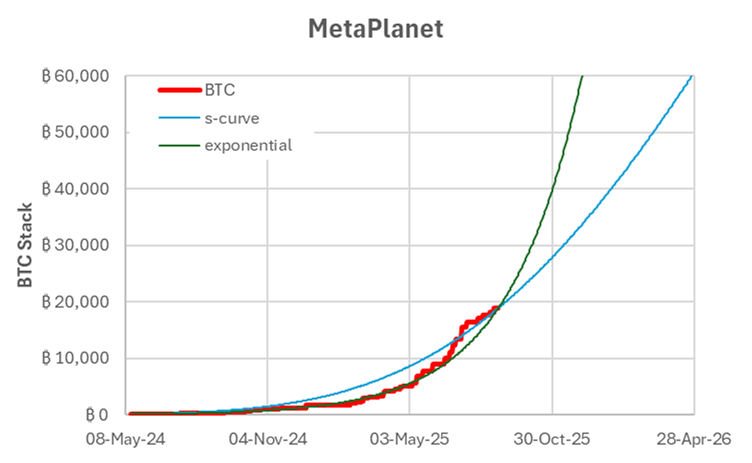
Their patient and disciplined rate of stacking, maintaining a BTC Yield of 0.9% per day for 15 months, gives them a long runway.
The one caveat is that they need to make a smooth transition to preferred shares to continue raising funds and decrease their reliance on the ATM, especially when the price is headed down. However, significant developments appear to be underway for MetaPlanet, with some bullish news announcements on the horizon.
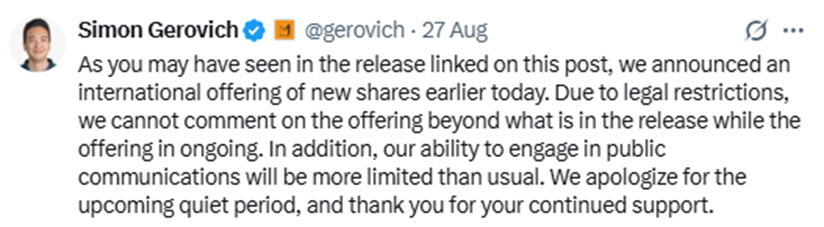
If all goes well, we should see a lot of shorts quickly cover and retreat; however, we don’t yet know what a successful preferred shares-powered BTC-TC looks like. Between Strategy and MetaPlanet, we’re venturing into new territory. If MetaPlanet and Strategy can wean themselves off the ATM and move to preferreds, it will pave the way for the broader BTC-TC ecosystem, showing the way once their collateral is big enough.
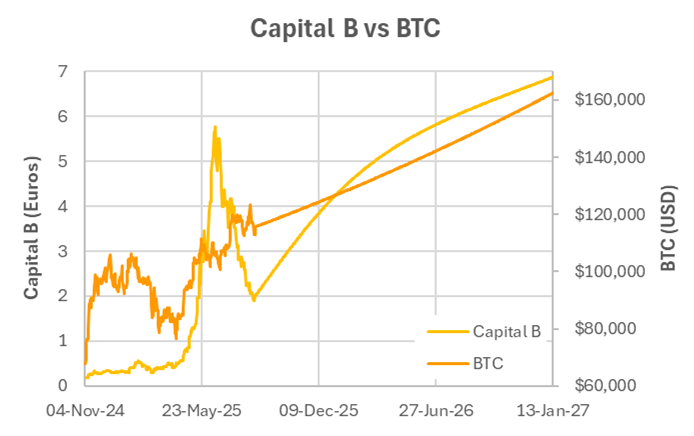
Capital B — OTC & mNAV
Capital B (previously The Blockchain Group) has also experienced a substantial pullback from its peak, just as it was starting to unleash its ATM facility.
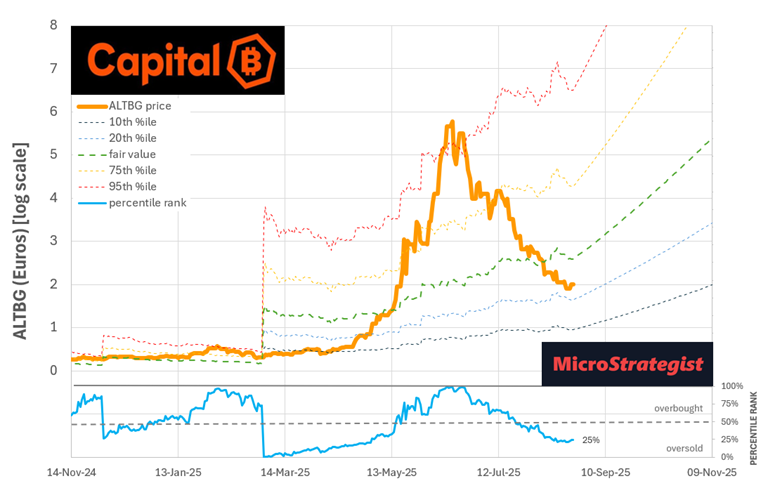
While our model struggles a bit with Capital B because their initial BTC acquisitions through BTC-denominated bonds were somewhat irregular (hence the confidence bands are quite broad), it currently places them at the 21st percentile of their fair value range.
While initially growing quickly in the European market, they have been somewhat hindered by the time it has taken to get their OTC ticker listed in the US (although it is tradeable through IBKR, and the OTC ticker is expected to be listed any day now).
Although their rate of stacking has been hindered lately, the future looks bright once the BTC-TCs turn around and they can resume their current rate of stacking.
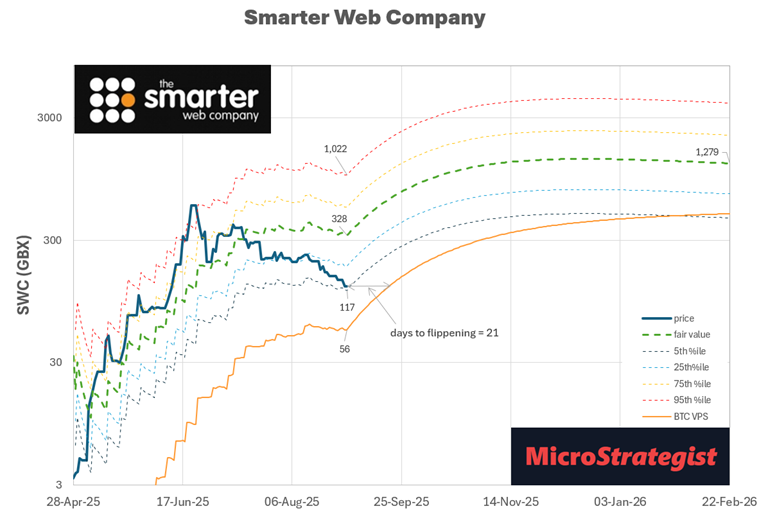
Smarter Web Company — Early Sprint, Second Wind?
I’ve been fascinated by SWC. They initially started stacking super aggressively, on track to acquire all 21 million BTC by November. More recently, their rate of growth has slowed somewhat, but is still relatively healthy in the short term.
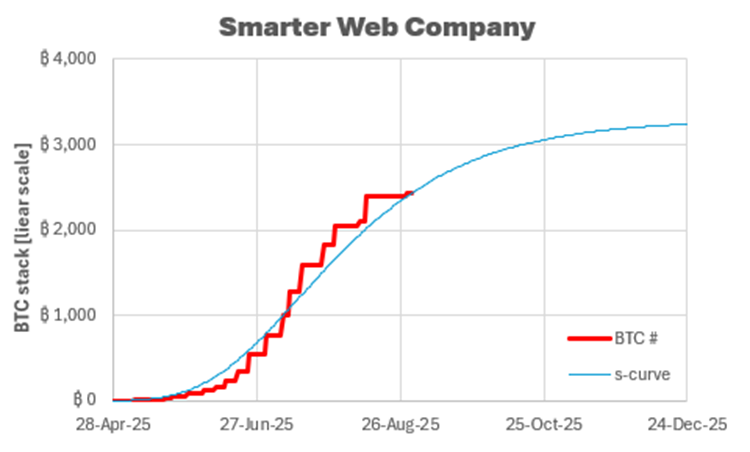
Right now, they’re beaten down, currently sitting at the 6th percentile of their fair value range. If the BTC-TC space experiences a turnaround, it could potentially reach its fair value price (currently 328 GBX) and beyond. However, due to the slowing growth in BTC stacking, our model suggests that we should watch for a slowdown in growth later in the year.
Their ability to continue to grow depends on their access to capital in their current market. To date, Andrew has done a phenomenal job of raising capital despite being on the smaller Aquis exchange. But continuing at their current rate of growth could be challenging.
Our models will continually update as more data becomes available. Currently, they need to buy at least 18 BTC per day to maintain their current growth rate, and significantly more to reach their stretch goal of 210,000 BTC.
Semler — Slow & Steady
Semler has a long history of consistent stacking; however, with their mNAV currently less than 1, they will have to rely on debt and preferreds to maintain their current rate of 14 BTC per day.
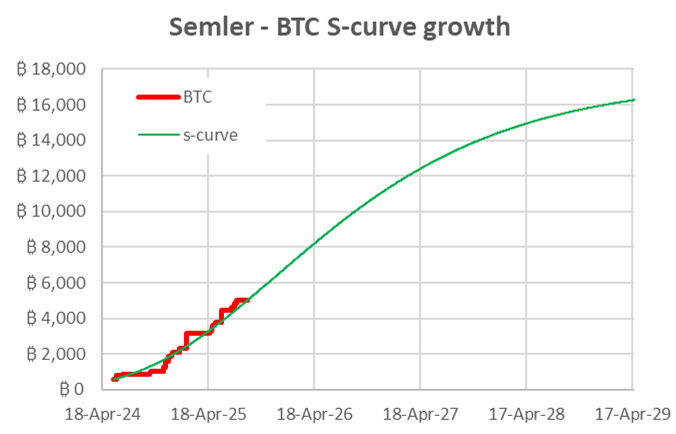
Semler’s share price has been in the doldrums for most of this year, but with consistent stacking and BTC share price appreciation, this trend is expected to turn around eventually. However, if they manage to get anywhere close to their end-of-2027 goal of 105k, there is a lot of upside.

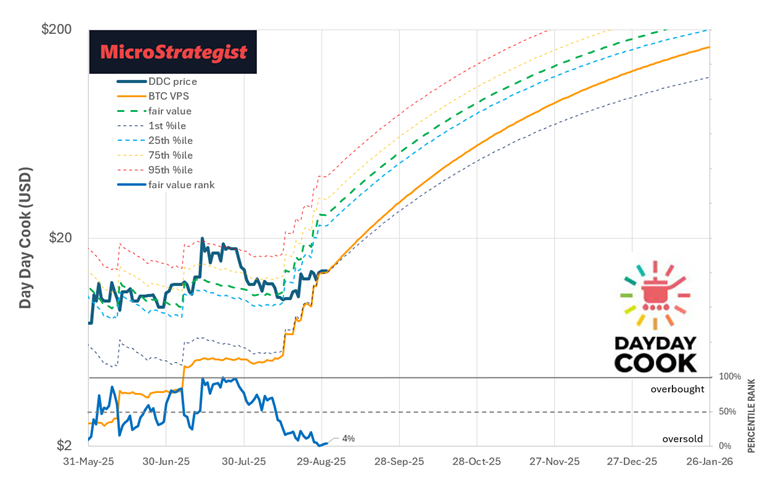
Day Day Cook (DDC)
Last but certainly not least, we have DDC, which has been on an aggressive Bitcoin buying spree lately. Our modelling puts them at 5,204 BTC by the end of 2025 vs their goal of 10,000.
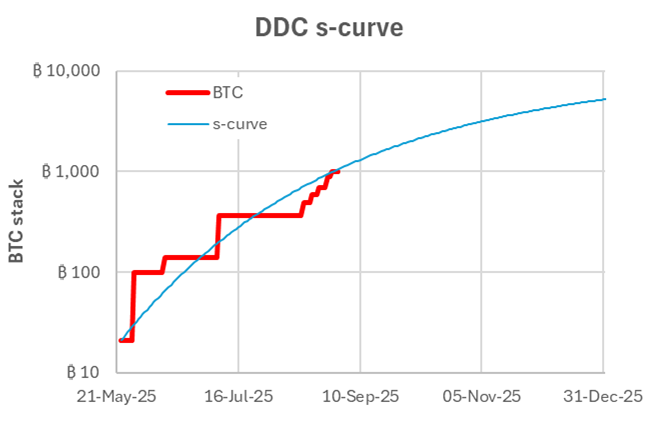
Whether they continue on their current trajectory or reach their aggressive stacking goal, they are currently the most promising BTC-TC of the bunch. With their recent stacking, they currently have an mNAV of slightly more than 1 and are sitting at the bottom of their fair value range!
Summary
Currently, BTC has pulled back significantly from its recent all-time high. While there’s no way to know the short-term trajectory, it seems safe to assume we’ll at least get a slow grind up over the longer term.
Most BTC-TCs have also pulled back significantly from their recent highs, with most of them trading at much lower mNAVs, meaning there is less downside risk of the mNAV imploding. So long as you believe in Bitcoin, there should be plenty of good times from there in the coming months.
If you’re patient, you can use the fair value ranges in the charts above to identify bargain basement prices in the BTC-TCs that show the most potential.
But remember, if their stacking slows, their BTC Yield and hence mNAV will fall, so it pays to be vigilant, especially with the smaller BTC-TCs that are moving too fast not to slow down.
For information/education; not investment advice.