BTC Yield vs. Gravity: Which Treasury Companies Will Keep Climbing?


In the race to become the ultimate Bitcoin treasury, fast stackers earn the spotlight—and the highest premiums.
Investors love companies that grow their BTC per share rapidly.
Why?
Because higher BTC Yield supercharges mNAV (multiple of net asset value), and share price follows — rocket fuel for market hype.
But here’s the catch: as the BTC stack grows, sustaining that momentum becomes exponentially harder.
This article examines:
· why even the fastest stackers eventually slow down,
· how to recognise the early warning signs, and
· what the data reveal about which companies might soar—and which are flying too close to the sun.
The BTC Yield Dilemma: High Early Gains vs Long-Term Sustainability
BTC Yield is a measure of how fast a company is increasing its Bitcoin holdings relative to its existing stack. For example, a company with 1 BTC that adds 1 BTC has a yield of 100%, but if it holds 10 BTC and adds 1 more, the yield drops to 10%.
As a company’s BTC stack grows, sustaining a high BTC Yield becomes exponentially harder.
BTC Yield = New BTC / Existing BTC
Eventually, every company hits a wall. With only 21 million BTC in existence and finite pools of capital to siphon from, exponential growth must slow.
When it does, mNAV compresses, sometimes brutally.
Every company, regardless of its initial momentum, moves from the top-right to the bottom-left of the ‘bubble chart’ below.
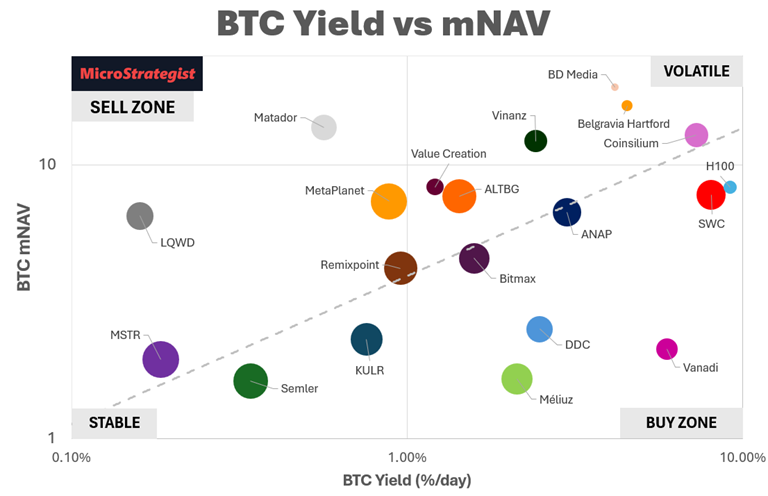
The job of every BTC treasury CEO? Plot the optimal trajectory to stay in flight for as long as possible before gravity takes over.
Oh, and ideally, they want to glide gently down rather than having their BTC Yield engine sputter and stall and then fall out of the sky!
No doubt there will some CEOs and early seed investors will eject early when they see the early warning signs while retain investors remain onboard, sucking hard on the hopium and filled with unwavering belief.
Our goal is to teach you to read the dashboard dial so you can make informed decisions and avoid a crash and burn.
BTC Yield: Skyrockets vs. Gliders
Here’s a snapshot of the BTC Yield across 16 treasury companies we’re currently tracking.
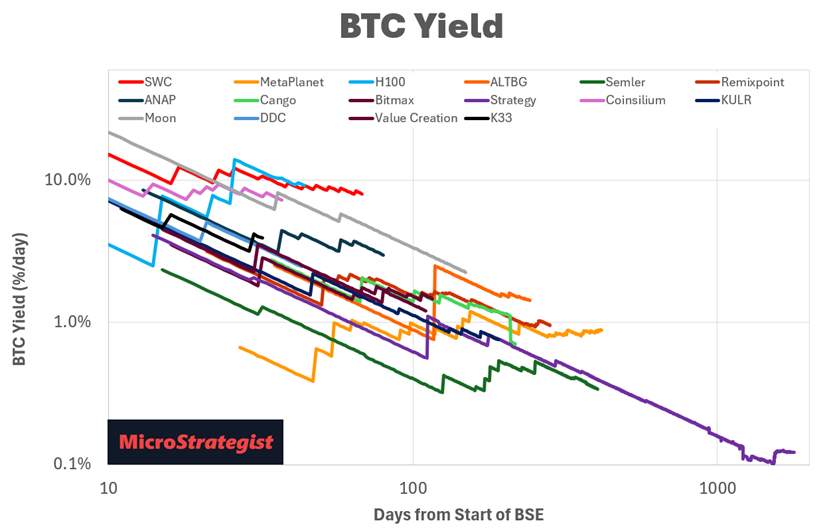
Every company starts with high hopes and ambition, declaring that they’re “gonna buy bitcoin as fast as possible.” But over time, the inescapable gravity kicks in. Each new BTC purchase is another leap for the sky, but the growing weight of their BTC bags pulls them back to earth.
The winners? Companies that take a sustainable approach—those that climb steadily, not recklessly.
· H100, for example, exploded out of the gate, peaking with a staggering 11% BTC Yield per day after 34 days. Based on the trajectory of every other BTC treasury that has come before them, chances are that gravity will bring them back down to earth before too long.
· The Smarter Web Company has done a remarkable job of keeping its BTC Yield at 8% after 58 days. However, at this rate, they’re on track (in theory) to acquire all 21 million BTC by October this year. That’s clearly nonsensical and impossible. Hence, their yield will decelerate as daily funding requirements become astronomical.
· Then there’s MetaPlanet. With a consistent 0.9% daily BTC yield, it has managed to grow its BTC/share exponentially for over a year. This measured pace gives them a significantly longer runway, ideal for investors seeking a longer-term trade and less anxiety that their yield engine will stall and they’ll fall from the sky.
The Law of Diminishing BTC Yield
The chart below shows the average BTC yield over time, following a power-law decay with a high correlation.
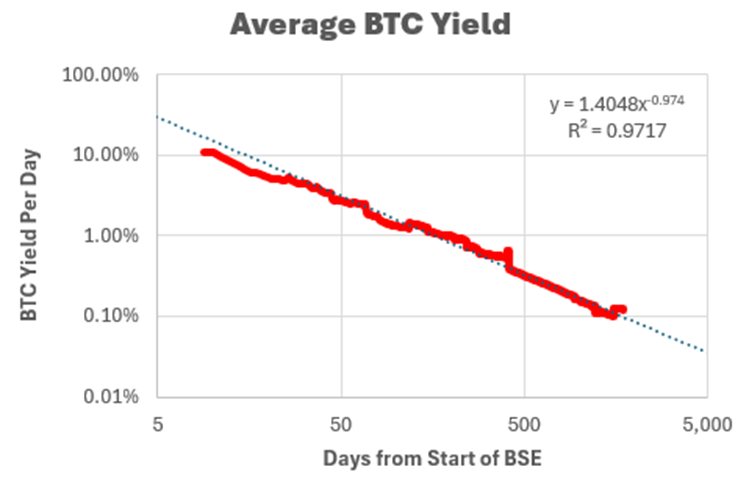
This power law trend is similar to what we observed in Bitcoin as it grew, characterised by rapid gains with high volatility and risk in the early days, and more stability but lower growth in the longer term.
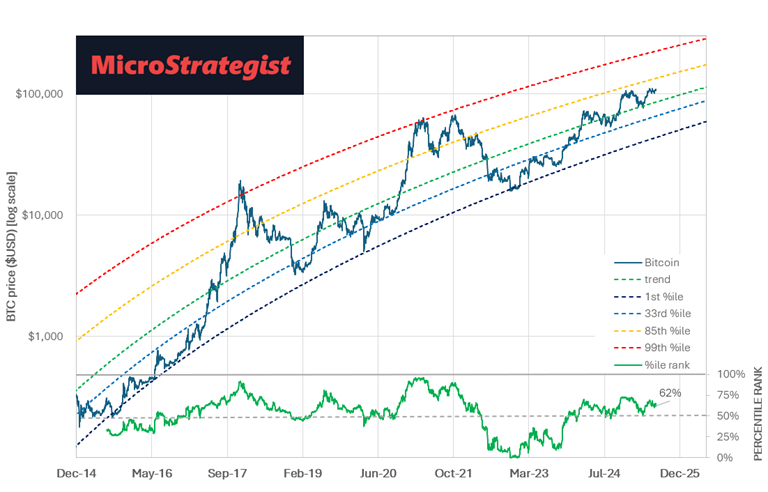
Many wish they could have bought Bitcoin back in 2010. The good news is that BTC treasury companies give you a similar opportunity!
But investors need to be aware that the rapid growth (accumulation) stage of its lifecycle is shorter. To survive for the long term, they will all have run Saylor’s bond/preferreds playbook to remain relevant after a year or two.
mNAV: Market Hype vs. Fundamentals
Remember the formula:
Stock Price = BTC Price × BTC/Share × mNAV
If we can forecast the trajectory of BTC (using the power law) and model BTC/share using BTC Yield trajectories, that leaves mNAV—the wild card.
Fortunately, the same power law dynamics can again be used to model the trajectory of a company’s mNAV.
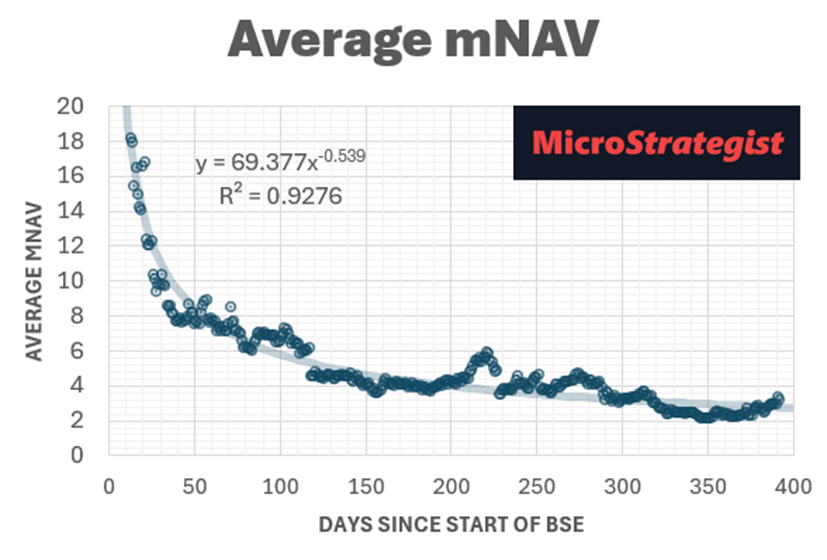
In the short term, mNAV is heavily sentiment-driven—fuelled by fear, greed, and hype. So, the raw data is noisy. But when we average mNAV by day since inception across companies, a trend emerges.
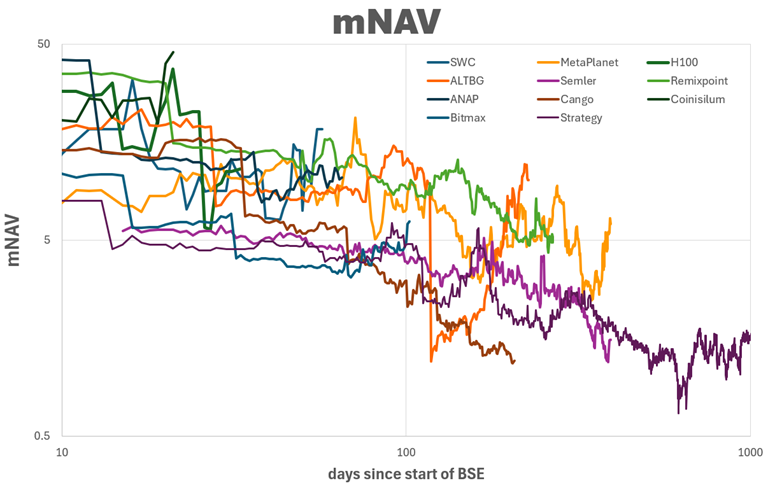
Just like BTC Yield, mNAV also decays according to a power law. As companies mature, the premium investors are willing to pay trends toward 1. Early rockets attract irrational exuberance, but it doesn’t last forever.
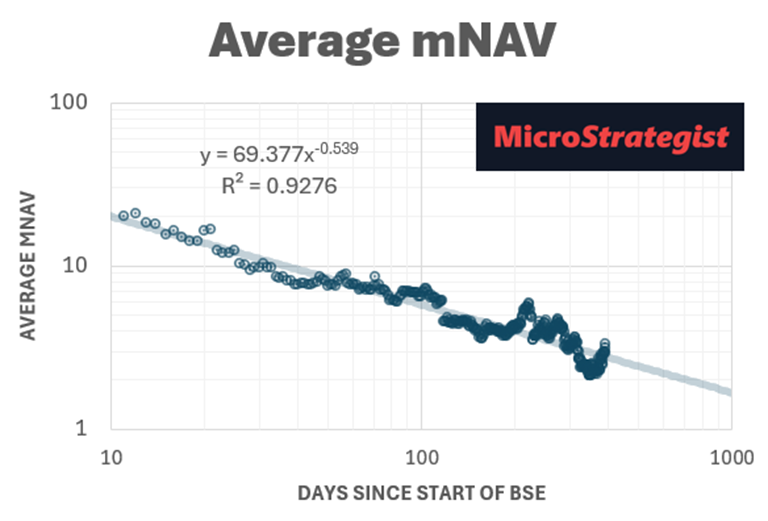
The following chart displays the same data in log-log space, showing that as a Bitcoin treasury company ages, the mNAV trend approaches a value of 1. So long as they can keep buying more bitcoin, mNAV will remain greater than 1, but not by much.
Worked Example: DDC
The biggest trap that many fall into when modelling the growth of Bitcoin and treasury companies is assuming exponential growth can continue indefinitely. Unfortunately, this often leads many to be overly aggressive and get burned.
Fortunately, modelling the various parameters as a power law gives us a much more realistic estimate of where a company may end up based on its early behaviour. As we gather more data, the model projections become more robust, and our predictions become more accurate. However, there will always be those who want to jump in early to achieve rapid early gains.
To illustrate this, the chart below displays the actual power law regression of DDC’s BTC Yield, which starts high and quickly declines, eventually approaching 0 asymptotically.
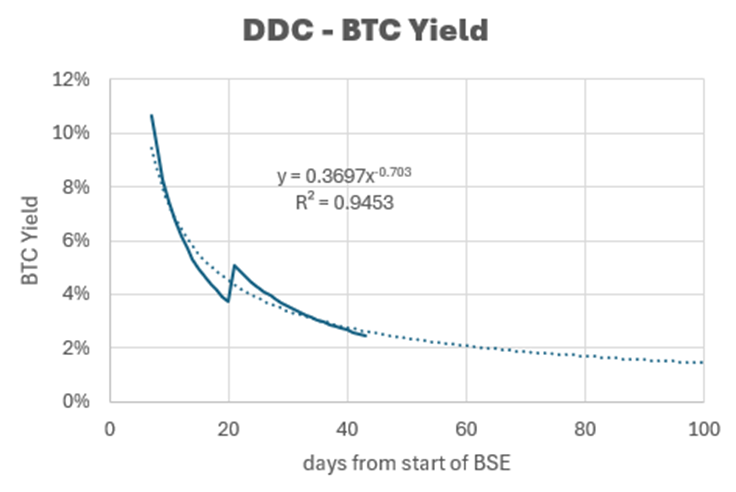
Every day without a bitcoin buy sends their projected BTC Yield down faster, which will flow onto sentiment and hence mNAV. Tracking BTC Yield keeps everyone honest and alert, allowing investors to rotate out of underperforming stocks.
The mNAV data tends to be a lot lumpier, but as the data unfolds, the power law can help us determine where the long-term trend may be going, eventually drifting towards 1.
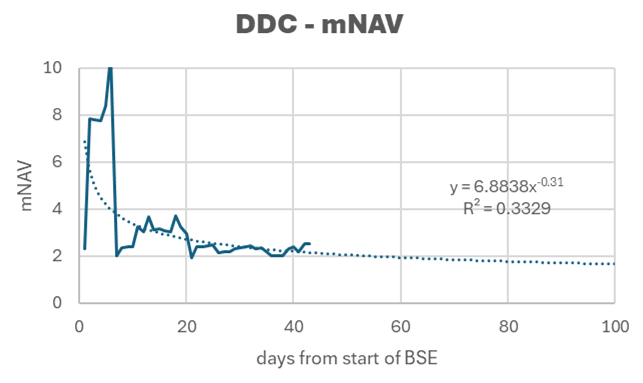
We can then combine the three power law projections (Bitcoin, Bitcoin yield, and mNAV) to predict where a Bitcoin treasury company may be headed over the medium term. Importantly, note how the projection in the log chart below begins to roll over as BTC Yield and mNAV trend downward, per the power law. There’s still a ton of upside, but it’s not exponential, which is, by definition, unsustainable.

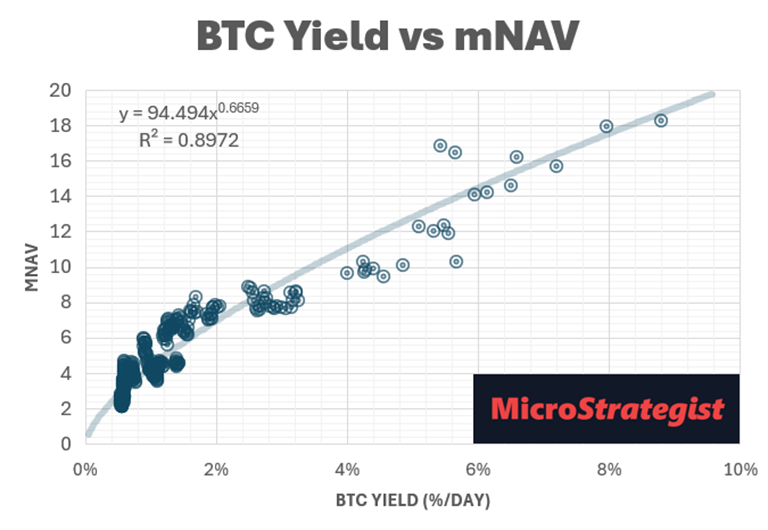
BTC Yield vs. mNAV: The Rocket Fuel Equation
To summarise, Bitcoin, BTC Yield, and mNAV all follow a power law.
By modelling these three parameters, we can forecast the likely trajectory of any BTC treasury company’s share price.
However, this approach to modelling Bitcoin Treasury Companies provides a strong early indication: Will this company be a rocket or a dud?
And most importantly, it tells us when it’s time to hold, bail, or jump aboard a faster ship.