Inside the Engine Room: How Our BTC-TC Portfolios Power Growth

In this article, we take a closer look under the hood of our BTC-TC portfolio system to help you understand why some companies earn a higher weighting than others—and how our strategies adapt dynamically to market movements.
What Drives Our Rankings? A Look at Portfolio Weightings
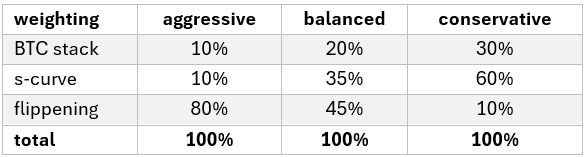
We’ve created three distinct portfolio types, each with different weighting strategies:
· BTC Stack: Measures how much BTC a company currently holds. This favours more established companies with greater liquidity, making it ideal for conservative investors.
· S-Curve: Captures the growth trajectory of a company’s BTC stack. If a BTC-TC is growing consistently, we want exposure. However, if that growth begins to slow, the system automatically reduces its weighting before the mNAV implosion occurs.
· Flippening: Our take on DTC’s mNAV model. Smaller BTC-TCs can quickly close the gap between their share price and BTC value per share (VPS) and grow rapidly—especially early on.
Model Fit as a Bitcoin Purity Signal
We previously introduced our Bitcoin VPS model fit score. Companies at the top of this chart have share prices that closely track their BTC value per share, suggesting the market views them as “pure-play” BTC proxies.
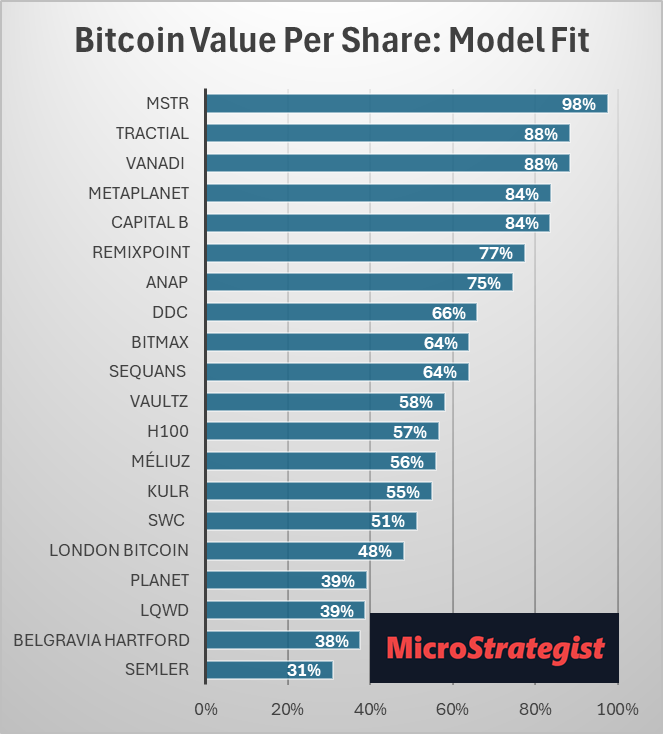
We incorporate this as a multiplier for Flippening scores in the aggressive portfolio, improving signal precision.
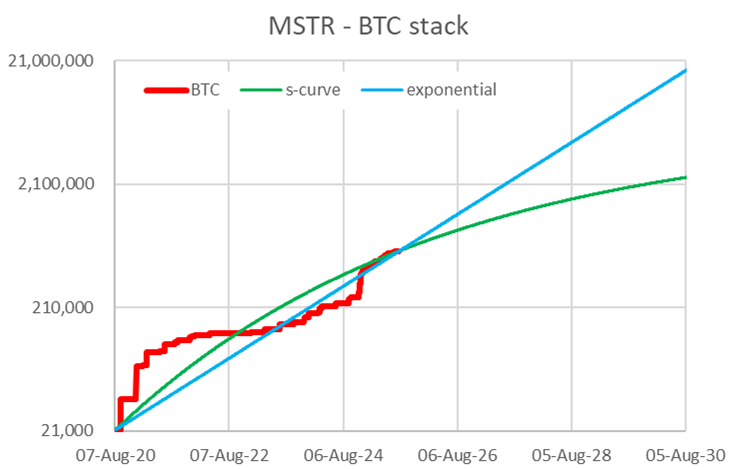
Can You Trust the Trajectory? S-Curve Confidence Explained
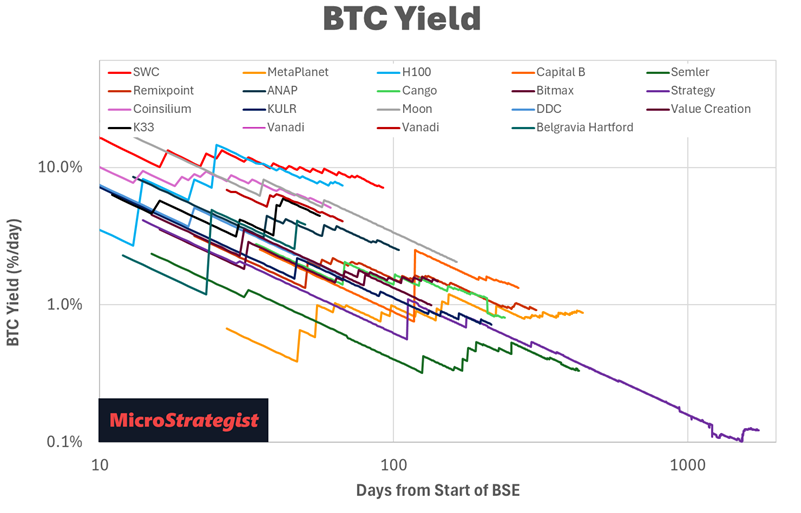
This chart illustrates the fit between a company’s BTC stack growth and its s-curve trajectory. Companies like MetaPlanet and SWC, which frequently and consistently announce purchases, offer higher confidence in future projections.
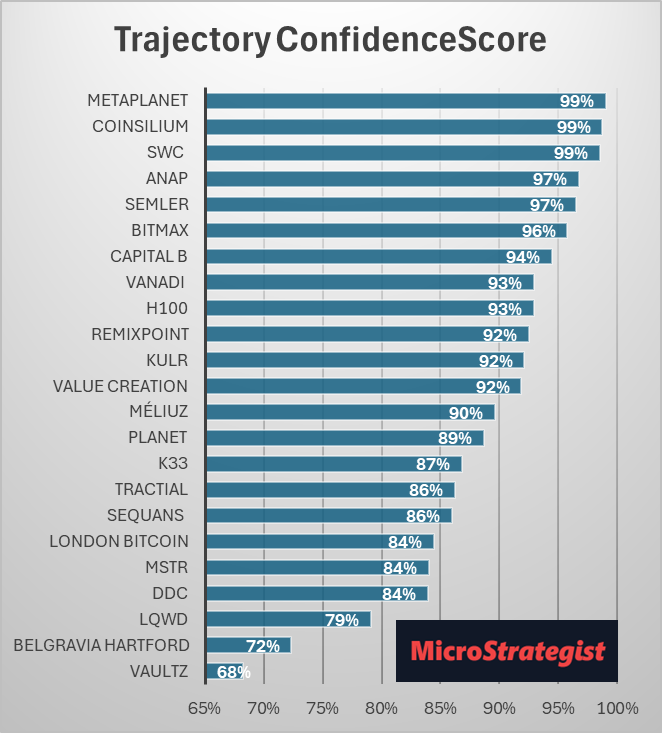
This approach also drives the s-curve factor that dominates the conservative portfolio.
SWC’s Relentless Climb: Can It Keep Stacking at This Speed?
I have been pretty vocal lately about the Smarter Web Company growing too fast, not to slow down eventually, but for now, it’s still on a tear, with only a small deceleration in their BTC Yield.
While they are succumbing to the inevitable slowing of BTC Yield, their growth has been remarkably consistent. Despite being on the smaller AQIS exchange in the UK, they have a very loyal shareholder community.
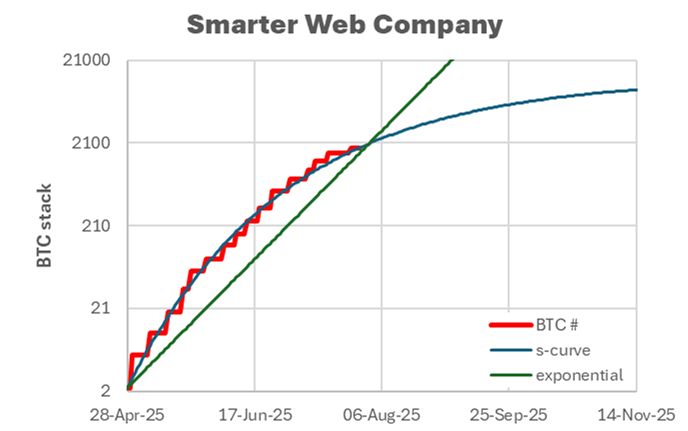
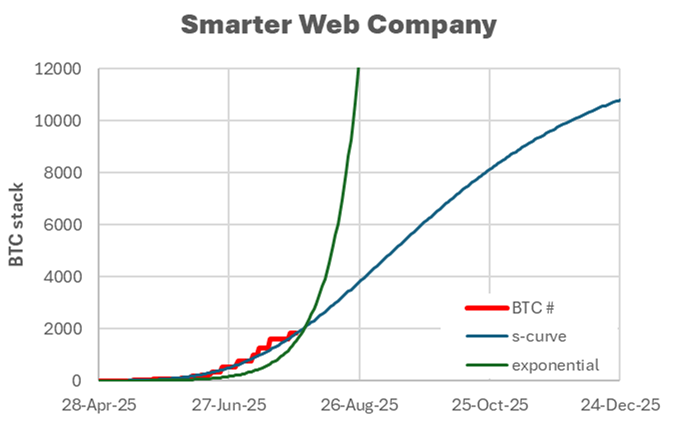
As you can see in the s-curve chart below, their growth has departed from exponential growth; however, their longer-term trajectory appears quite solid at present, with an inflection date (i.e., the point at which they transition from growing to slowing) of September 7, 2025.
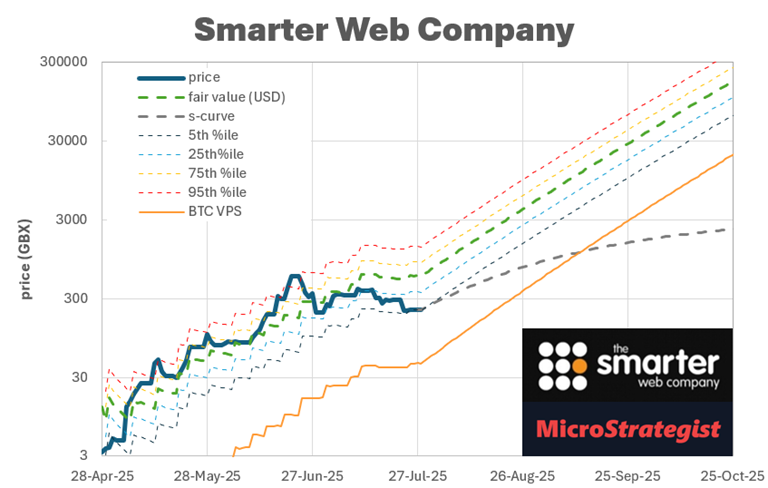
After an incredible run since they started stacking on 28 April 2025, peaking late June, they are now sitting at the lower end of their fair value percentile range (6.5th percentile).
As you can see in the chart below, their BTC value per share continues to climb with the recent price pullback; they currently have a days-to-flippening (i.e., when the BTC VPS is projected to exceed their current share price based on the trajectory of their mNAV and BTC Yield) of 23 days.
As shown in the chart below, based on the s-curve growth projections, SWC (red line at the top) appears to have the most potential for rapid growth in share price over the next three to four months (followed by Belgravia Hartford, H100 and DDC). If you were feeling the FOMO because you missed the initial run-up, this may be a good time to jump in for the next ascent.
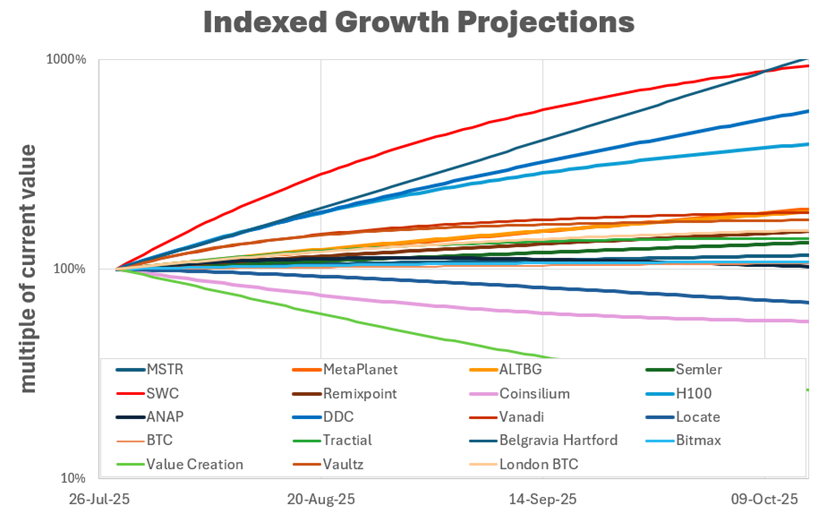
Obviously, nothing is risk-free, but the most significant risks for SWC appear to be the emergence of other competing BTC-TCs in the UK (e.g., SATS, Coinsilium, London Bitcoin, and Vaultz), some of which have access to the liquidity of the LSE.
To continue growing long-term, SWC will need to get its preferreds listed sooner and ideally move to the LSE rather than later. With their rapid growth, time is of the essence. SWC’s run appears far from over, but things are moving fast, so stay alert with this one.
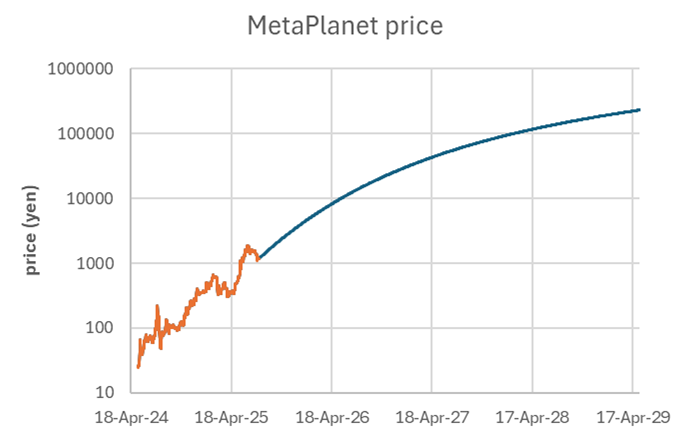
MetaPlanet: Quietly Building One of the Most Sustainable BTC Stacks
A month or so ago, we warned that MetaPlanet was approaching the top end of its fair value range.
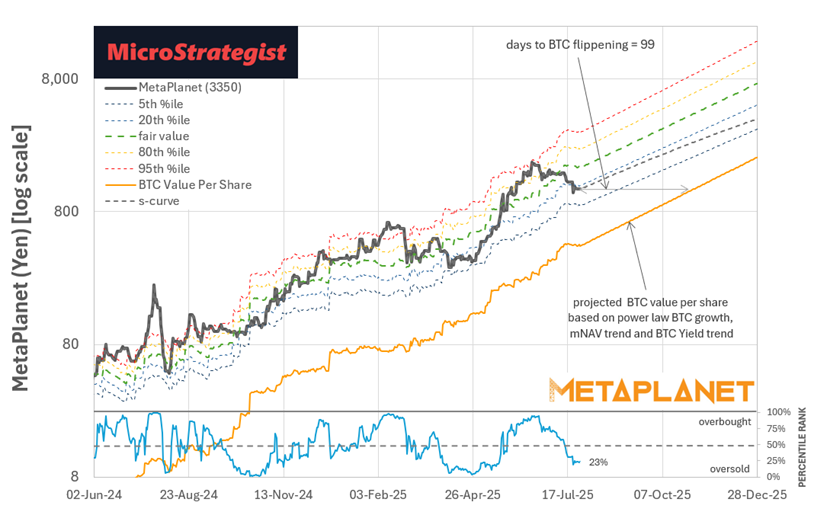
Since then, we’ve seen a solid pullback from the peak, which has made it harder for them to run their ATM-like facility and buy BTC, but the long-term trend appears to be well intact. Their days-to-flippening have now dropped to 99 days, and the price is currently sitting at the 23rd percentile of their fair value range.
In contrast to SWC, MetaPlanet have had very sustainable exponential growth in its BTC per share. The only reason the projected s-curve departs from the exponential trend is that I’ve limited their ultimate BTC stack (because there’s only 21 million coins to be had).
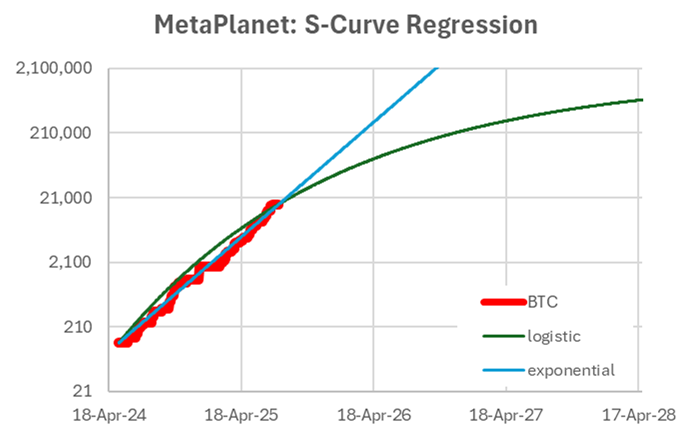
Even with this, their inflection date isn’t until Feb 2028. So they have a long way to run.
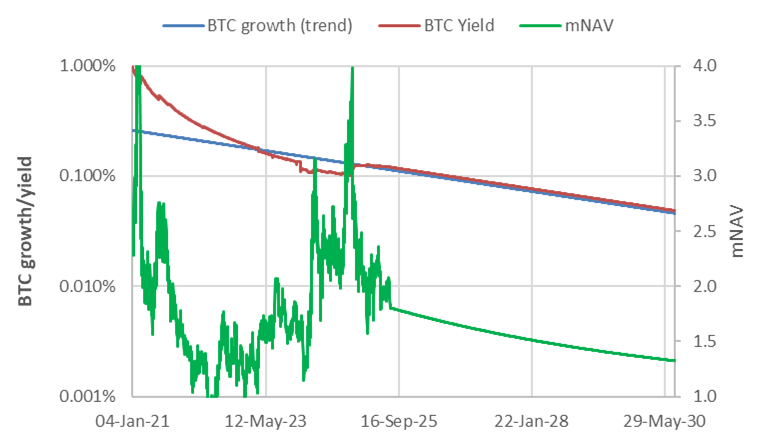
The chart below illustrates how we’ve utilised the deceleration of BTC growth to infer future BTC yield and mNAV.
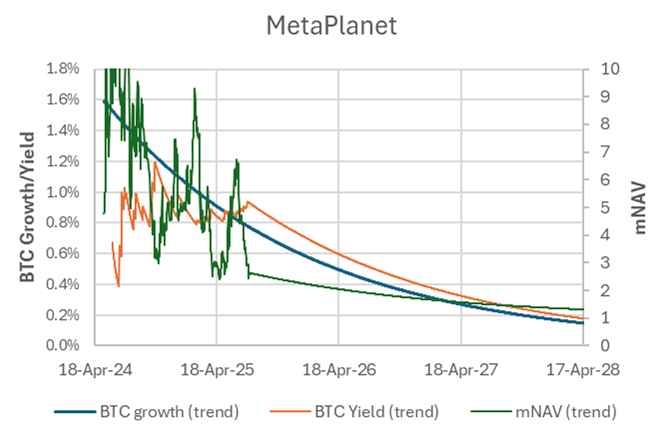
Even when we conservatively assume that their mNAV will eventually drift down to 1, MetaPlanet has a long way to go from there, especially if it can get its preferred shares rolling for the yield-starved Japanese market.
Of course, no model can predict the future; it can only anticipate the future trajectory. So stay tuned for future updates.
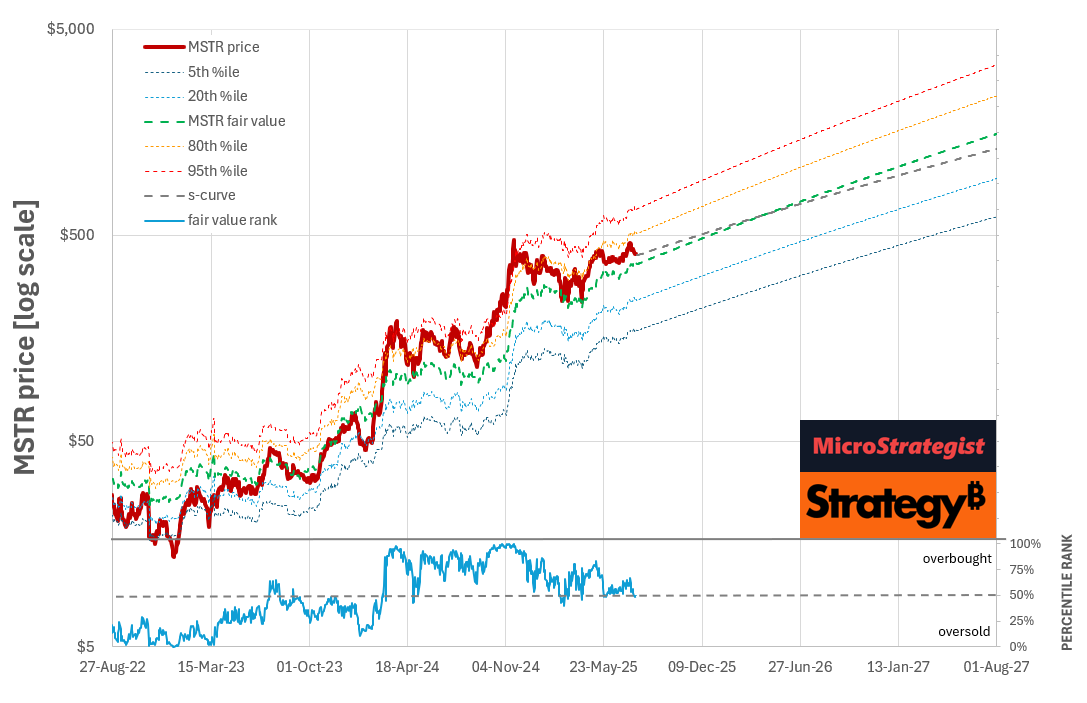
Strategy (MSTR): The Steady Titan in a Sea of Rockets
It’s sort of crazy to think that MSTR is now the boring, low-risk stable BTC-TC. How far we’ve come in just a few months since the heady days of October and November last year! Now with a massive BTC stack, their yield is much smaller.

Our fair value model indicates that MSTR is currently sitting just above fair value. Due to the lower BTC Yield and its slower growth rate compared to some of the other smaller BTC-TCs, it may not move as quickly. However, because it still generates a yield from its suite of preferences, it will continue to grow faster than BTC.
With only 21m BTC available, even Strategy will have to slow eventually, but that won’t be for a while yet. Their slow, steady behemoth strategy gives them a long runway to keep recycling fiat into BTC, especially with STRC, STRK, STRD and STRF in place to fuel their BTC Yield turbine.
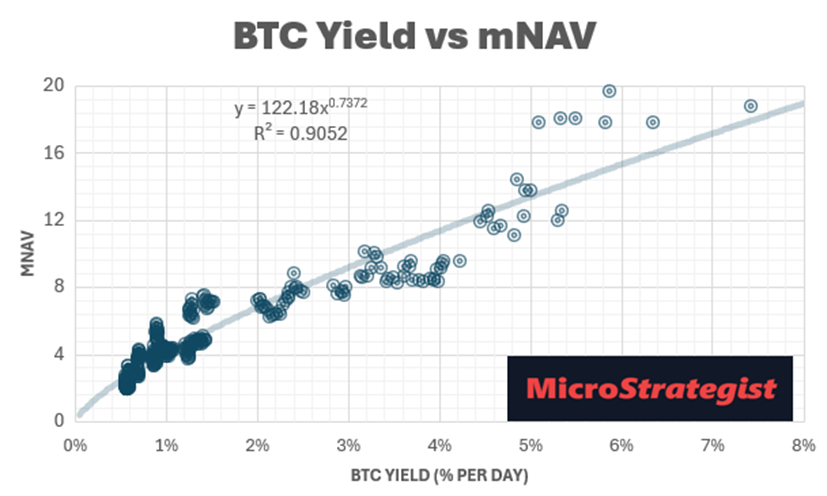
Our model assumes that BTC Yield and mNAV will trend downward in line with their growth in BTC, albeit at a very slow pace. Holding some MSTR is ideal for a long-term, conservative portfolio, but it can be somewhat unexciting for those seeking entertainment and adrenaline from their share price fluctuations.
Jeff Walton and the MSTR True North Crew are still banking on a significant increase in mNAV with potential S&P inclusion on the horizon. However, while passive inflows will undoubtedly help boost mNAV, allowing them to keep their BTC Yield from slowing, now that I understand the inherent link between BTC Yield and mNAV, I don’t think we will see an mNAV above three or four ever again.
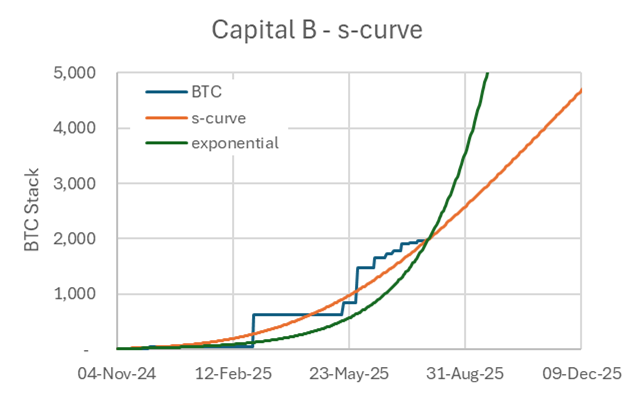
Capital B’s Comeback: Is the Next Phase About to Begin?
Similar to SWC and MetaPlanet, Capital B (previously The Blockchain Group) has also seen a pullback since mid-June. They’re now trading below their fair value with 127 days to flippening. As with many of the larger companies, we see a fairly close alignment between the conservative S-curve price prediction and the far value forecast, which is based on their current BTC Yield.
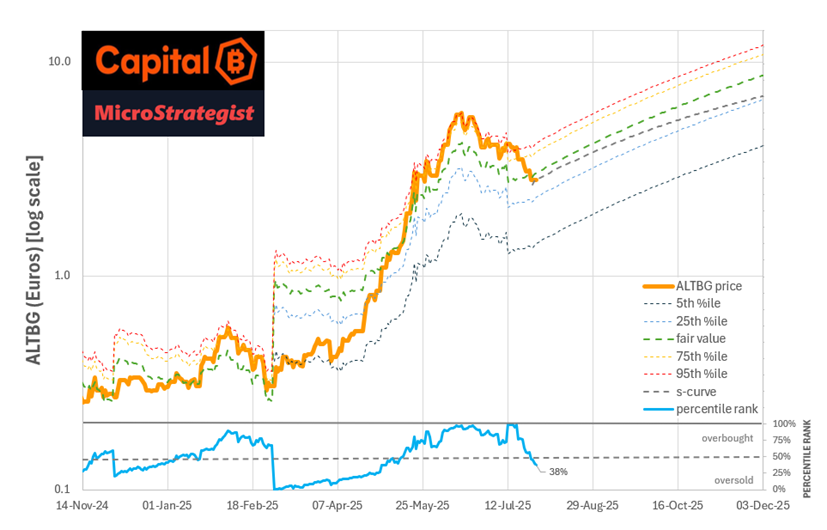
Capital B has recently activated their ATM facility and has started making smaller purchases, rather than relying on new investors with a large BTC stack. However, the pullback and heavy shorting have slowed that somewhat.
However, with their OTM market ticker about to be released in the US, preferred shares in the works, and a shiny new website and dashboard, they have a long way to go before slowing down.