Is Bitcoin Winter Cancelled? Why This Cycle Feels Different

Every four years, like clockwork, the Bitcoin crowd gathers around the charts, waiting for history to rhyme, praying for the legendary 'God candle'.

But this time… feels like it might be different.
Cycles that once felt reliable — halvings, annual seasonality, even election-fuelled liquidity bursts — are showing signs of breaking down. Or perhaps, evolving?
After trying to force-fit Bitcoin’s price action into familiar frameworks, I’ve taken a step back.
What happens when you stop expecting the past to repeat — and start watching what’s actually unfolding?
In this article, we’ll explore a new model that blends fundamentals and macro trends — from hash rate and gold to election spending and money supply — to ask the big question:
Are the old Bitcoin cycles dead… or just changing shape?
Let’s dive into what the data is showing — and why this ‘cycle’ might surprise everyone.
From Cycles to Chaos: My Bitcoin Modelling Journey
Soon after I discovered the power of the Power Law, I started trying to model the bitcoin cycles that oscillate around the long-term log-log trend.
I followed @moneyordebt, Giovani, Sina and Plan C and tried to copy and refine, and synthesise everything they were doing into my models.
I developed a model that seemed to use the impact of historical annual, halving and election cycles to predict where Bitcoin might be going in the future.
It was working pretty well until the whole tariff thing appeared out of nowhere in January 2025, and the entire market slumped, including bitcoin. Unfortunately, the model couldn’t see that coming.
If found out the hard way, it can be dangerous to be confidently wrong.
Since then, I’ve been trying to let the market show the way.
I’m not so sure there’s a set-in-stone four-year bitcoin cycle anymore.
Nonetheless, I thought it would be interesting to go back and update the cycles model to see how it was working now. The observations were interesting enough to share.
Quick Take: What You Need to Know
· The impact of the halving cycle seems to be diminishing with time, but the US election cycle drives money flow (liquidity).
· This ‘cycle’ appears to be steadier, at least so far.
· With a larger market cap, less leverage, BTC-TCs competing to buy as much as possible, we may see a longer, slower grind up that largely ignores the traditions of the past.
The Power Law Holds Strong: Bitcoin’s Trend Still Intact
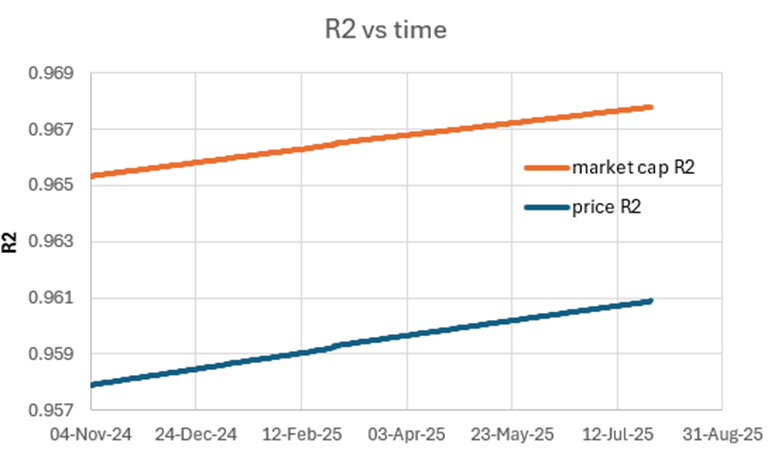
The good news is that bitcoin’s long-term power law trend is still very much intact.
The R2 for both price and market cap continue to climb, meaning the regression is getting even more resilient. As more data comes in, the model only gets stronger.
As I’ve mentioned previously, bitcoin’s volatility is decreasing and is now at an all-time low.
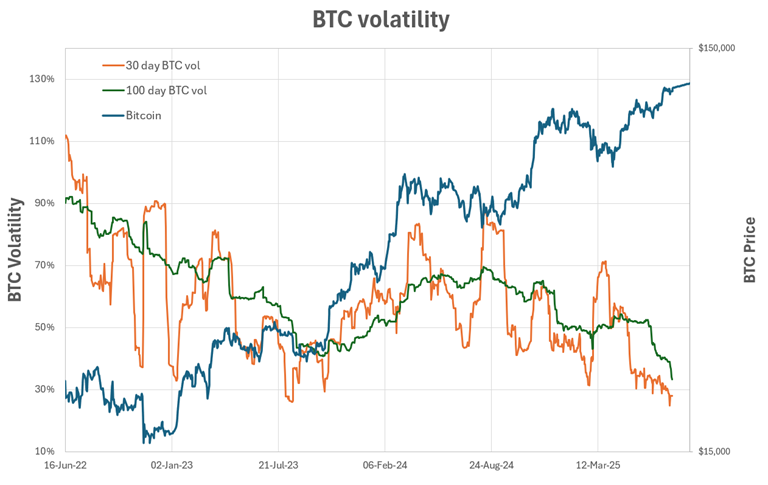
However, the gradient of the power law continues to steepen. While the power law quantiles suggest that we may not see $1m BTC by the end of the year, as some other models or hopium pushers predict, the long-term trend forecast price continues to steepen.
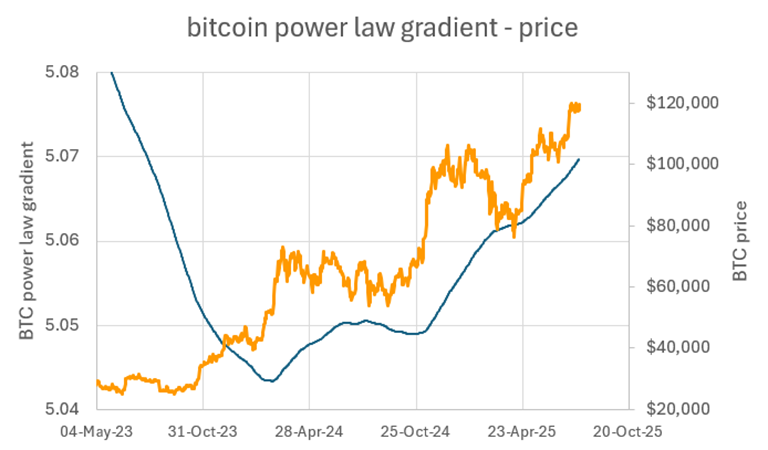
The power law says Bitcoin is currently running at a healthy 35% p.a. CAGR.
Bitcoin’s True Birthday? A Closer Look at Day Zero
Although the first block was mined on 3 January 2009, it didn’t start to be used as a store of value until sometime later, when it was frequently traded.
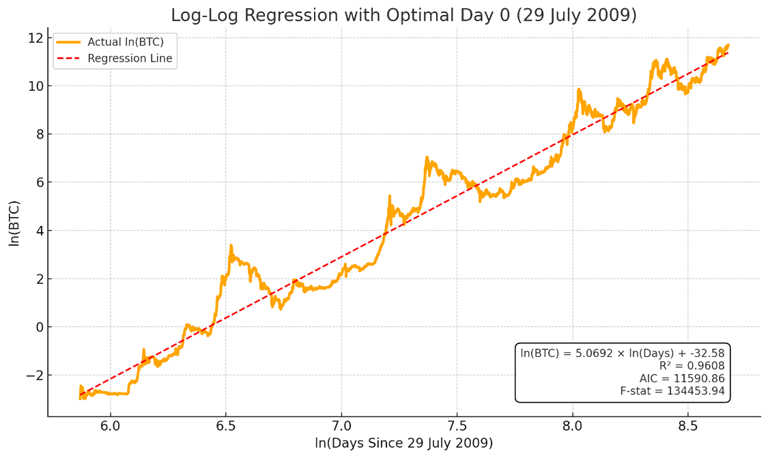
As shown in the charts below, R2, AIC, and F-stat are all optimised now with a Day 0 of 29 July 2009.
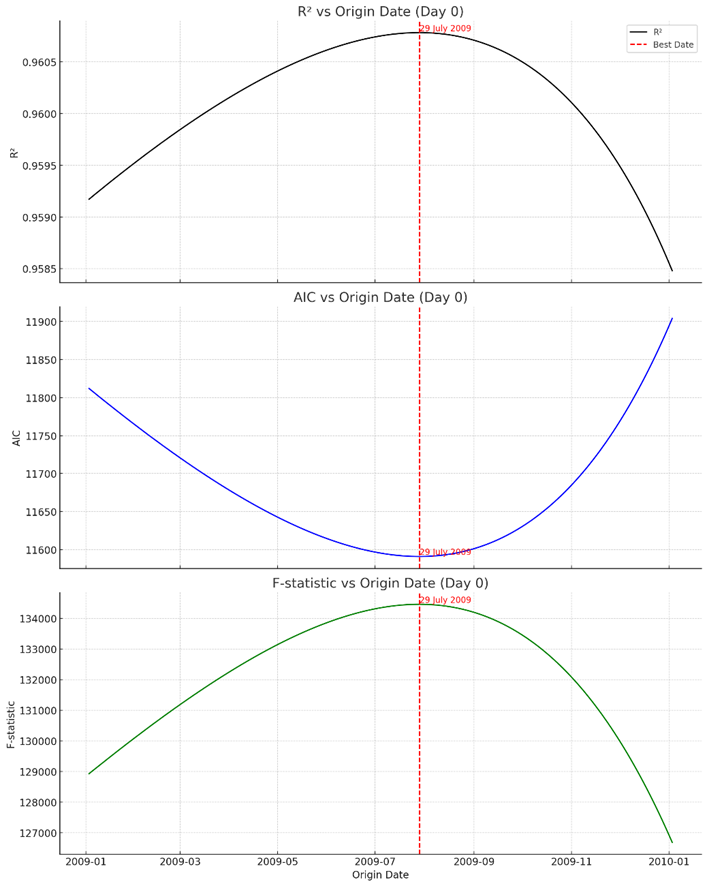
Why do we care? The Day 0 we assume in the model is critical to accuracy, and a more accurate model will give us more robust projections in the future.
Understanding the Extremes: What the Quantile Bands Tell Us
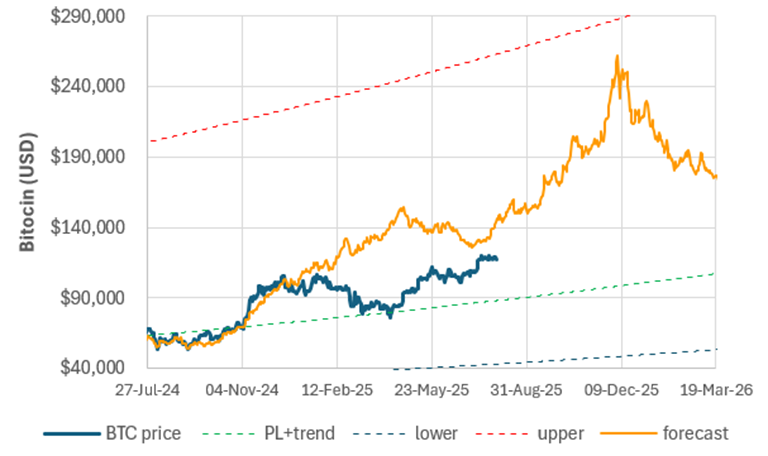
Looking at the quantile regressions is a great way to understand the likely range of Bitcoin’s price action in the future.
The 0.1st and 99.9th percentile quantile lines capture nearly all of the price action. Projecting these forward gives us a good idea of where we might be heading in the future.
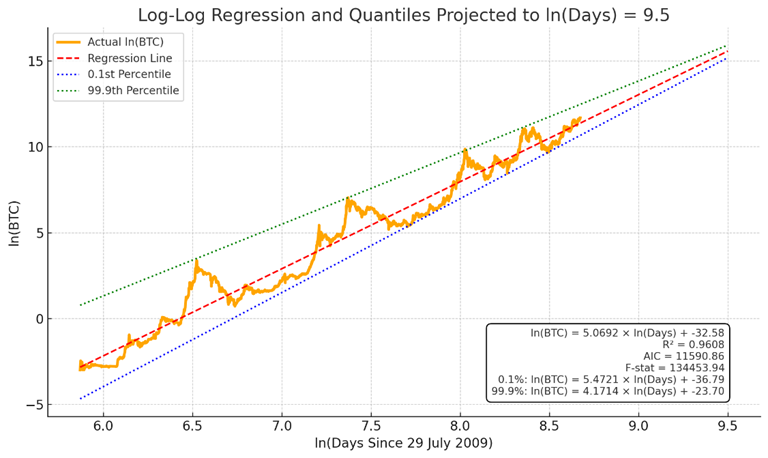
By looking at where the price sits between these lines, we can better understand the cycles.
The chart below shows how the price oscillates between the trend line and the upper and lower quantiles, with zero meaning that we’re at the power law trend, 1.0 is at the 99.9th percentile, and -0.2 is the lower power law quantile (i.e. support).
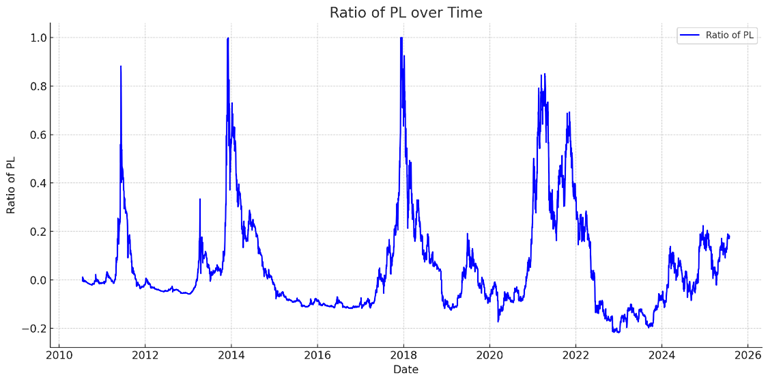
Notice how every four years or so, we’ve seen a spike. IF history repeats, we should be due for one pretty soon. But so far, no overnight ‘omega candles’.
The Annual Rhythm of Bitcoin: What the Calendar Tells Us
The data is super noisy, but we can extract the annual trends in the ratio as shown in the chart below.
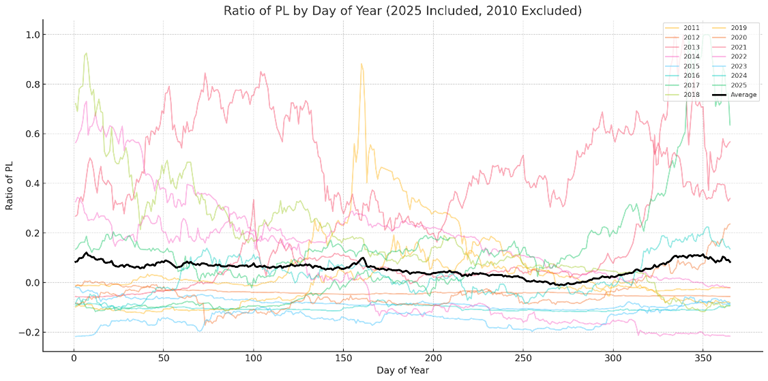
If we take the average of the 15 years of data to date, we see that we often get a trend down through the calendar relative to the power law trend year until we hit “Uptober” and a solid run-up for the rest of the year. The US summer months are often more subdued as traders ‘sell in May and go away’ for holidays.
This could potentially be one of the reasons that we’re seeing a pullback in the bitcoin treasury companies across the board right now, but it’s hard to know for sure.
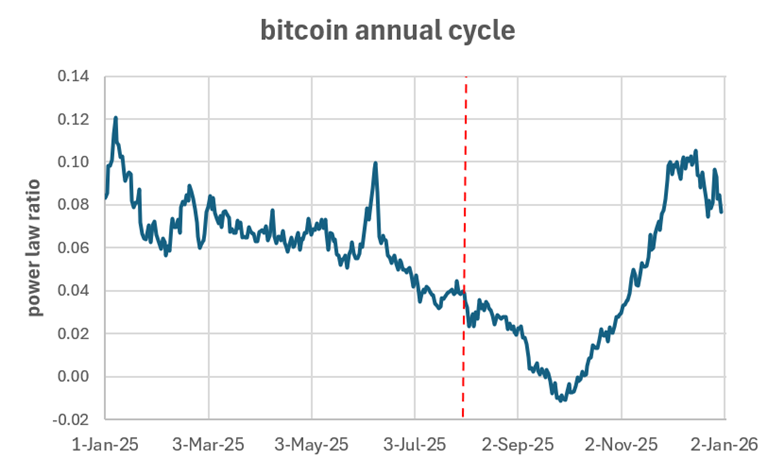
The red line on the chart above shows where we are today. If we just looked at the annual signal, we would say we are in for a couple more months of a downtrend before the annual rip-up.
But the annual trend is only a small part of the story. There are other factors at play…
Halvings Aren’t What They Used to Be
In the past, many have believed that the bitcoin cycles are driven by the bitcoin halving, after which the mining supply is halved.