Is the mNAV Worth It? Introducing “Days to Cover mNAV”

When investors pay a premium over a company’s Bitcoin per-share value, they’re not just buying Bitcoin—they’re betting on future accumulation.
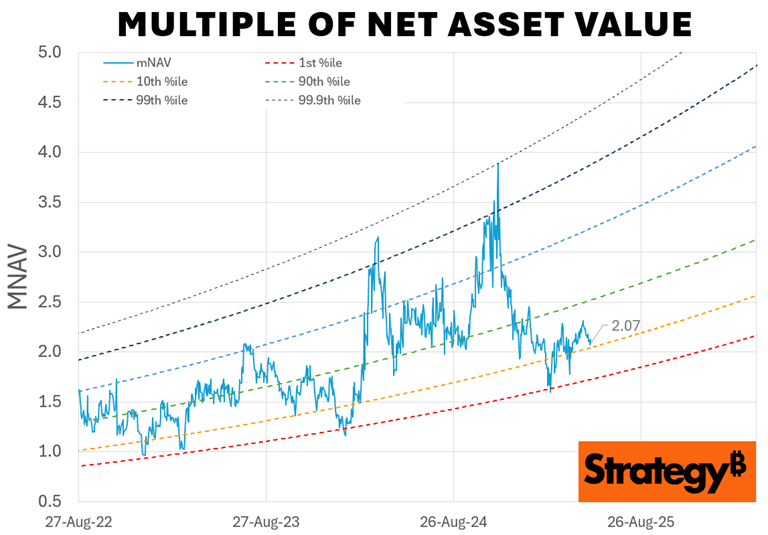
This premium is reflected in the multiple of net asset value (mNAV).
A company with an mNAV of 2.0 is trading at twice the value of the Bitcoin it currently holds. But is that premium justified?
That depends on how long it will take the company to “earn” that valuation with real Bitcoin.
Enter: The “Days to Cover” Metric
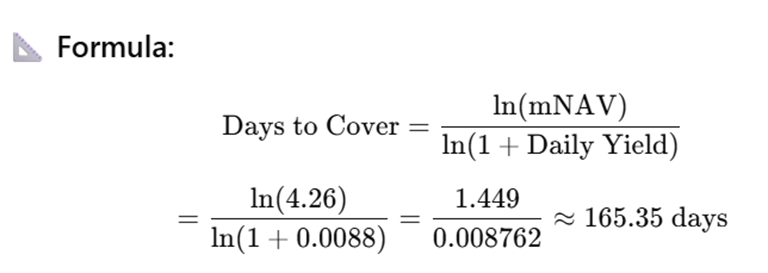
Recently proposed by Adam Back, the Days to Cover metric offers a simple, intuitive way to evaluate whether that premium is worth it. It answers a key question:
“How long will it take this company, at its current Bitcoin stacking rate, to earn the amount of BTC its market cap implies it’s worth?”
For example, if a company currently has an mNAV of 4.26 and is increasing its BTC stack at a daily yield of 0.88%. At this rate, it would take 165 days to own 4.26 times its current holdings—effectively “covering” its market valuation in BTC.
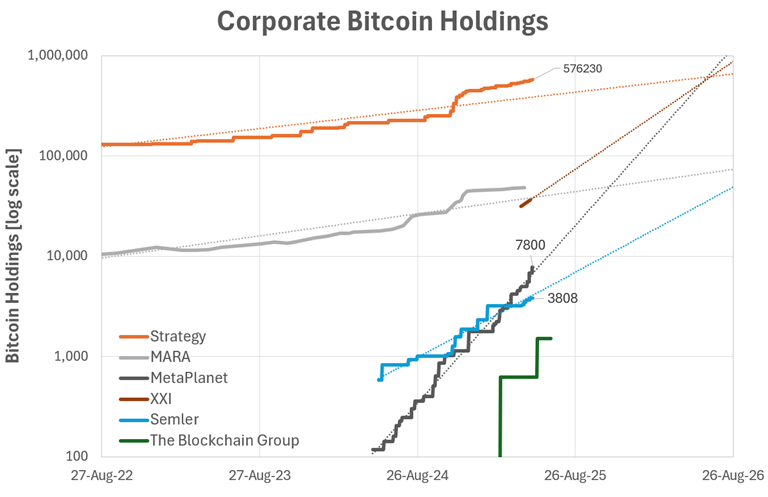
Comparing LBEs: Strategy vs MetaPlanet vs ALTBG vs Semler
The table below shows the current days to cover for Strategy, MetaPlanet, ALTBG, and Semler based on their 100-day BTC Yield. The days to cover metric is surprisingly consistent across the smaller LBEs.
|
MSTR |
MetaPlanet |
ALTBG |
Selmer |
|
|
current
mNAV |
2.1 |
5.08 |
9.4 |
1.5 |
|
100-day BTC Yield |
0.12% |
1.49% |
1.48% |
0.33% |
|
days to
cover |
626 |
110 |
152 |
114 |
Despite having smaller BTC holdings, companies like MetaPlanet and ALTBG are compounding fast, reflected in their shorter Days to Cover. Investors seem willing to pay a premium in anticipation of aggressive BTC accumulation.
Strategy has seen its mNAV hover just above 2.0 for a few months. Some blame it on the at-the-market (ATM) share sales. But the reality is they need to use all tools at their disposal, including the ATM, to keep their BTC Yield as high as possible to compete with the up-and-coming leveraged bitcoin equities that are following the Strategy playbook.
Strategy might be waiting for the next spike in volatility before issuing more convertible debt. They’re playing the long game—with a four-year track record and institutional trust. Strategy also has a four-year proven track record of reliable, consistent execution, which is also worth a premium. But the reality is that the smaller LBEs are catching up, driven by higher BTC Yields and faster compounding. The race is certainly on.
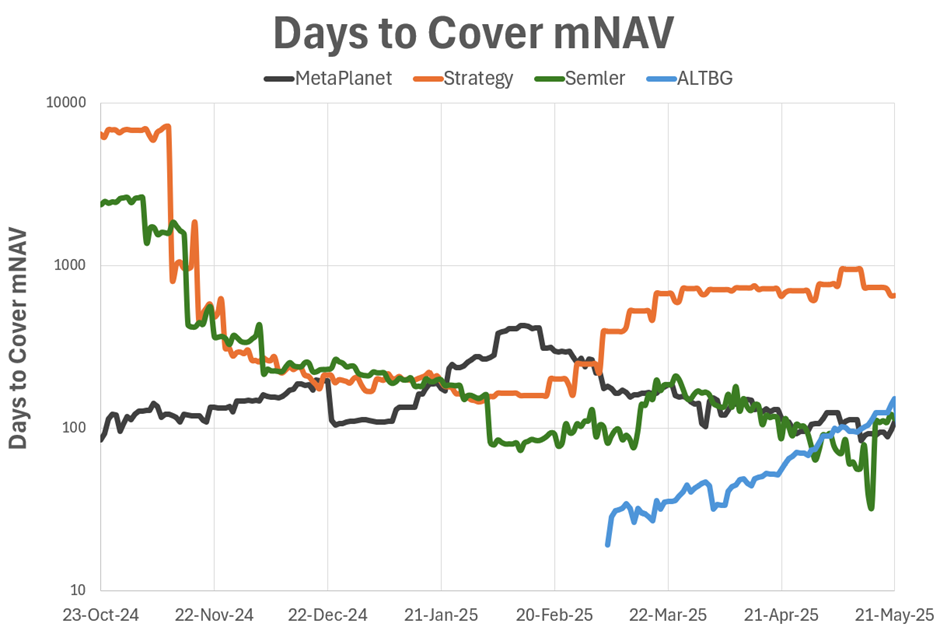
Days to Cover mNAV vs Time
Like everything in the Bitcoin world, days to cover moves fast! The chart below shows the movement of the days to cover metric since October 2024, highlighting:
· Strategy capitalised on the US presidential election run-up to stack bitcoin hard, with CBs and the ATM, but since February, they’ve struggled to keep stacking as hard, and Day to Cover has drifted up, meaning they can’t command as high a premium.
· Semler’s price and mNAV have drifted down despite the recent BTC price run-up, so even though their BTC Yield isn’t as high as MetaPlanet’s, their days to cover have been relatively low, until a recent jump in price.
· Both ALTBG and MetaPlanet have been stacking hard, with a BTC Yield of around 1.5% per day! Although they only had 620 BTC, the days to cover metric highlighted The Blockchain Group were a great opportunity back in March. Since then, their price has gone up 834%!

Conclusion: Why Days to Cover Matters
Days to Cover isn’t the only metric that matters, but it’s certainly an important one to watch as more and more leveraged bitcoin equities.
It helps investors assess which LBEs are truly earning their premium, based on actual BTC growth.
As more companies race to become Bitcoin holding giants, Days to Cover will offer a useful signal to separate BTC builders from BTC branders and level the playing field.
Want more?
Subscribe to MicroStrategist Pro for regular updates on Days to Cover and other critical metrics that help you navigate the growing universe of Leveraged Bitcoin Equities.