Lately, I’ve been laser-focused on one thing: understanding the future growth of Bitcoin Treasury Companies (BTC-TCs).
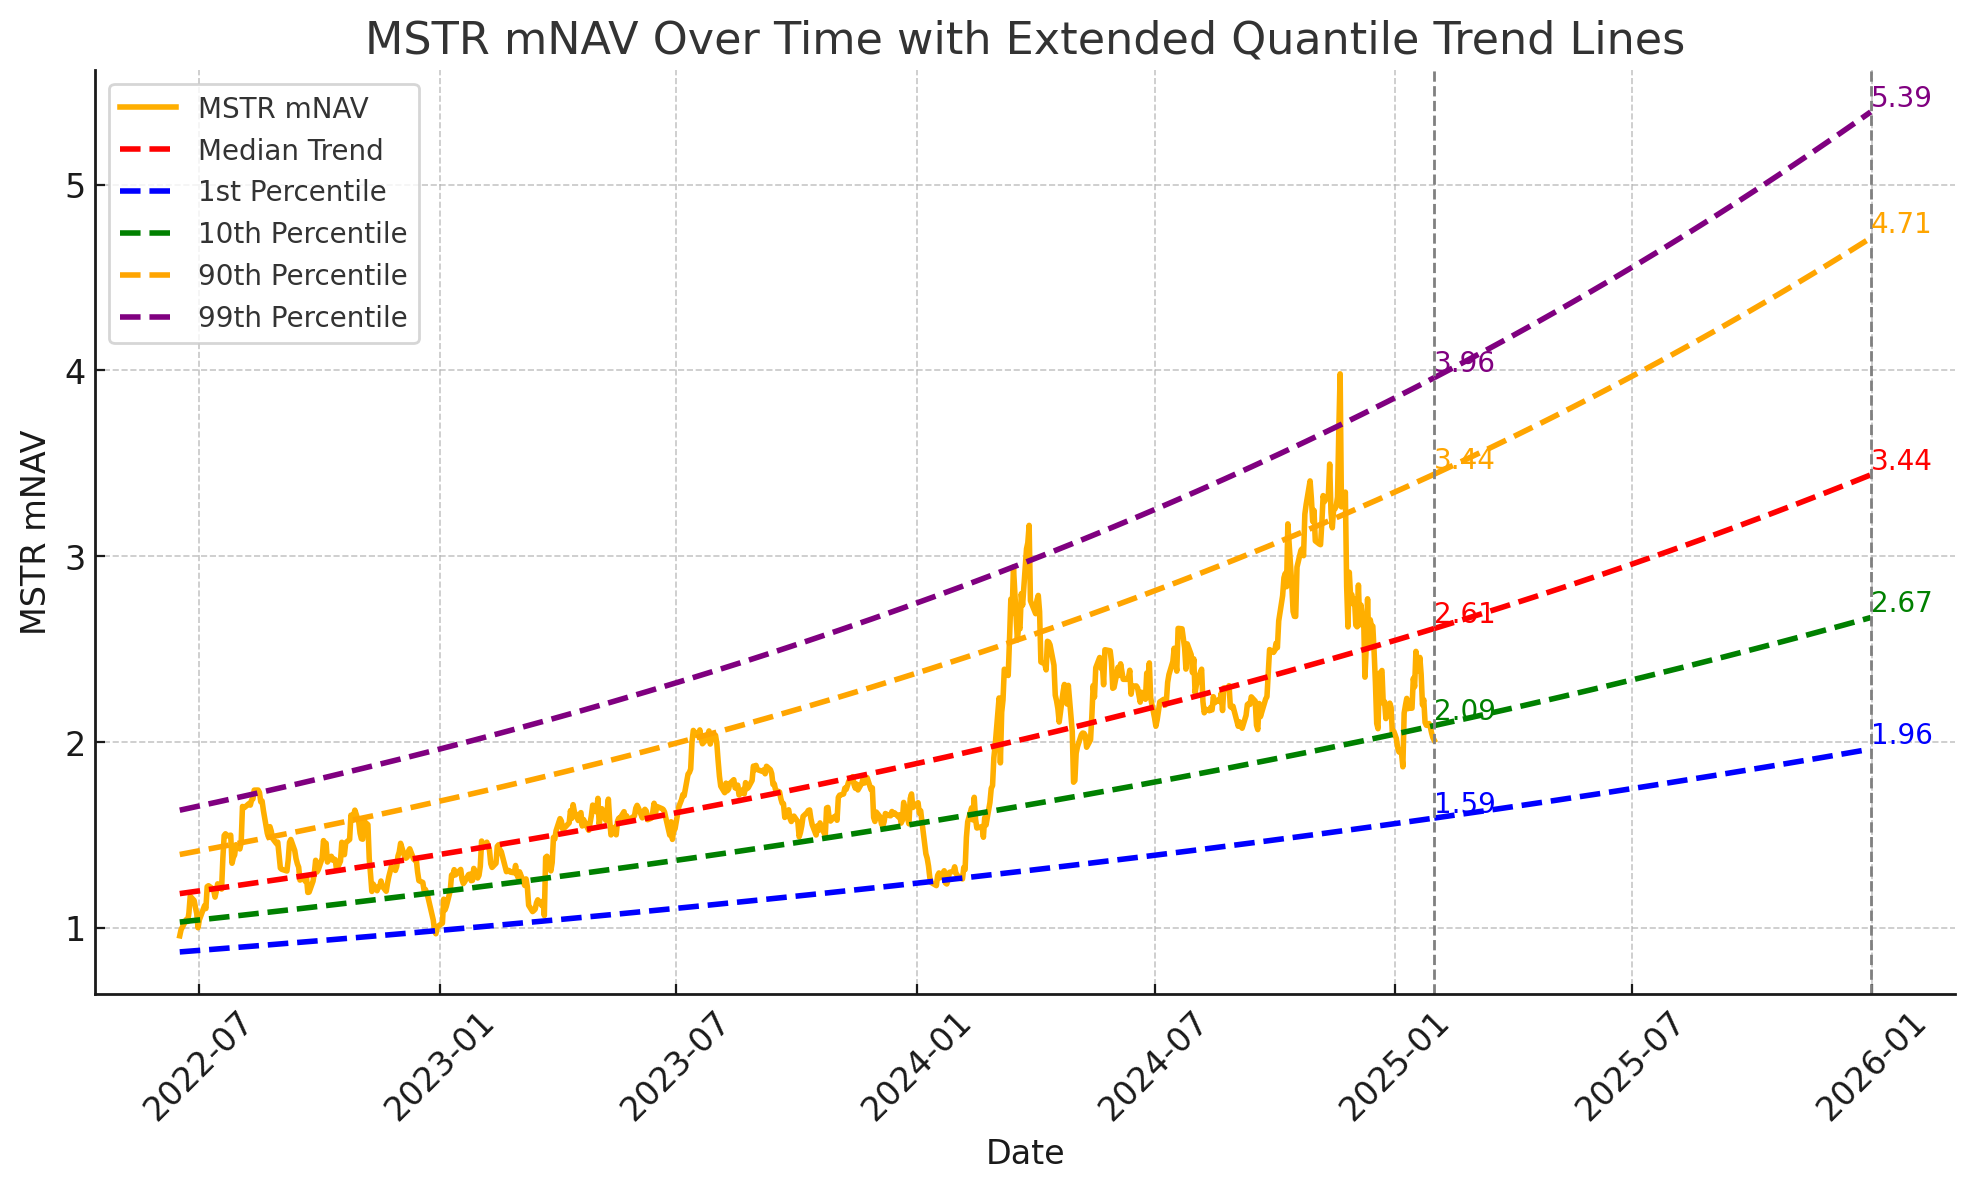
My initial piece — The Half-Life of Bitcoin Treasury Companies — received plenty of ‘constructive’ feedback. But, ironically, since then, we've seen significant mNAV compression, with many BTC-TCs pulling back by over 50%