Riding the Bitcoin Curve: How the Power Law Predicts the Future

Why does Bitcoin keep climbing, even through crashes? A little-known mathematical pattern—the power law—might explain.
The Bitcoin power law isn’t magic—it’s math.
Like any model, it’s not perfect, but it’s one of the best tools to understand Bitcoin’s long-term price.
While critics object that it predicts diminishing yearly returns, the power law has held up surprisingly well over time, adapts to new data and offers powerful insights into the future.
Bitcoin’s Volatility Smooths Out on Log Charts
Because Bitcoin has a fixed supply and fiat is elastic (with large swings in the money supply due to interest rates and quantitative easing), it has experienced extreme price swings since its birth on 3 January 2009, so it initially looks a bit scary.
But the good news is, the bumps become smoother when plotting the vertical axis on a log scale.
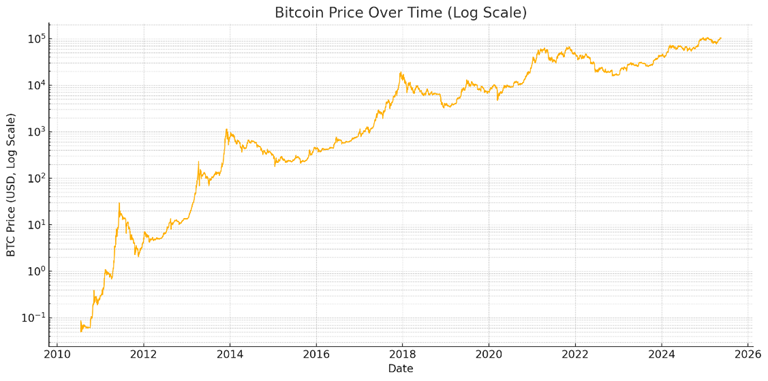
But as you’ll see, Bitcoin's growth makes even more sense when we plot time and price on a log scale (a.k.a. a power law).
What is the Power Law and Why It Fits Bitcoin
When dealing with things that grow from very small to very big, it helps to think in terms of log-log (rather than linear) growth. The growth of many things in nature, including bitcoin, becomes linear when plotted on a log-log chart.
The “power law” is not a “law” that bitcoin obeys; it’s just a mathematical relationship that follows the form of y=axk.
Refining the Power Law: Start Date Optimisation
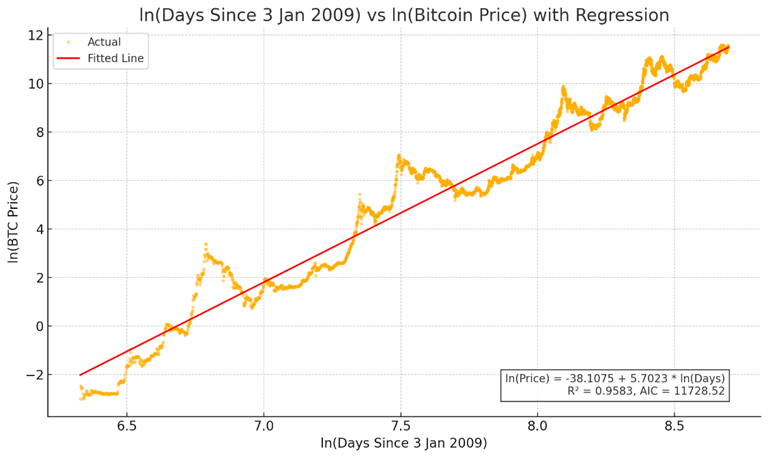
While the first block was mined on 3 January 2009, it didn’t start storing real value until a bit later, and the first price data we have from it being traded on exchanges is not until 18 July 2010. The chart below shows that when we optimise the start date, the trend line better aligns with the early data.
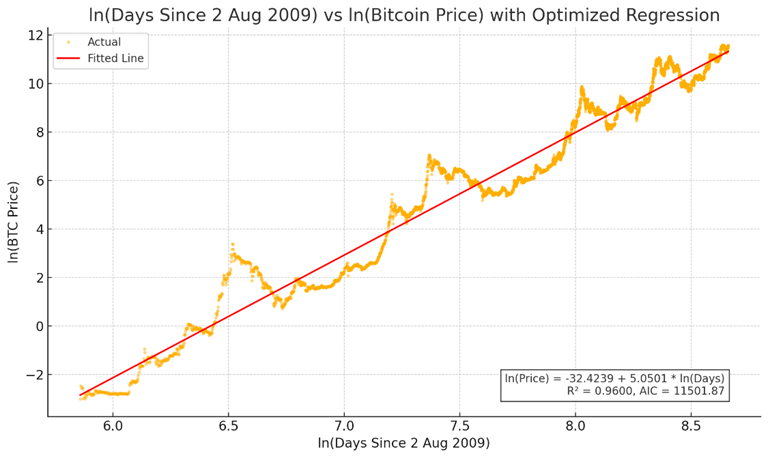
The table below shows that using the optimised start date (2 August 2009) gives an even better R2 and AIC.
|
Start Date |
Intercept |
Slope |
R² |
|
3 Jan 2009 |
-38.1 |
5.7 |
0.957 |
|
2 Aug 2009 |
-32.4 |
5.0 |
0.960 |
Visualising Extremes with Quantile Regression
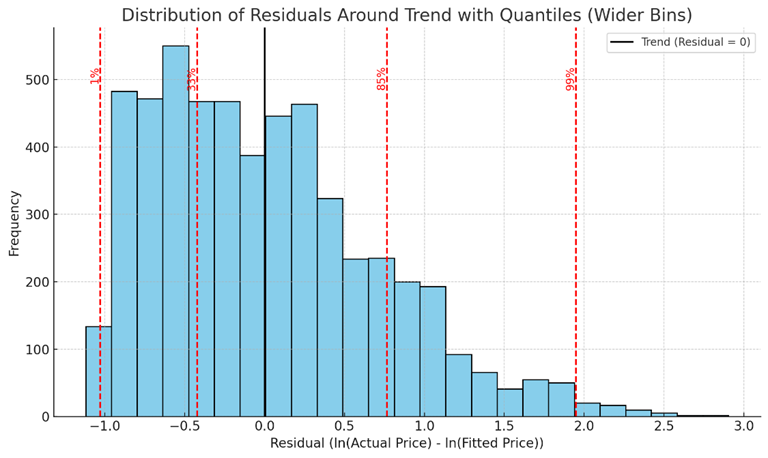
While the power law provides a robust long-term trend, there’s still a lot of volatility! To help explain this, quantile regression lets us model the average trend and the typical range of highs and lows Bitcoin tends to follow.
The chart below shows the distribution of residuals around the log-log trend. Towards the right, we can see that the bitcoin price spikes way above trend every few years, often followed by a crash.
Previous cycles appeared to be influenced by the halvings, which also happened to coincide with US presidential elections and liquidity cycles. But these cycles will dislocate as we advance, and the halving will have less impact. Future cycles will likely be primarily impacted by the amount of cheap money available in the international financial system (i.e. lower interest rates and quantitative easing).
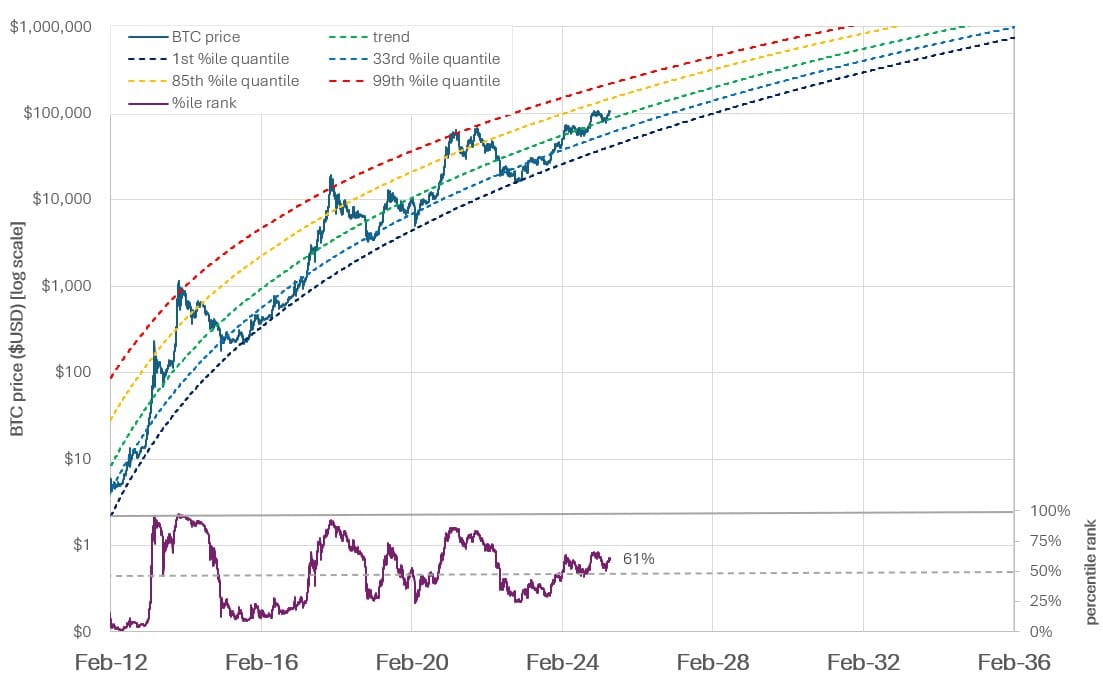
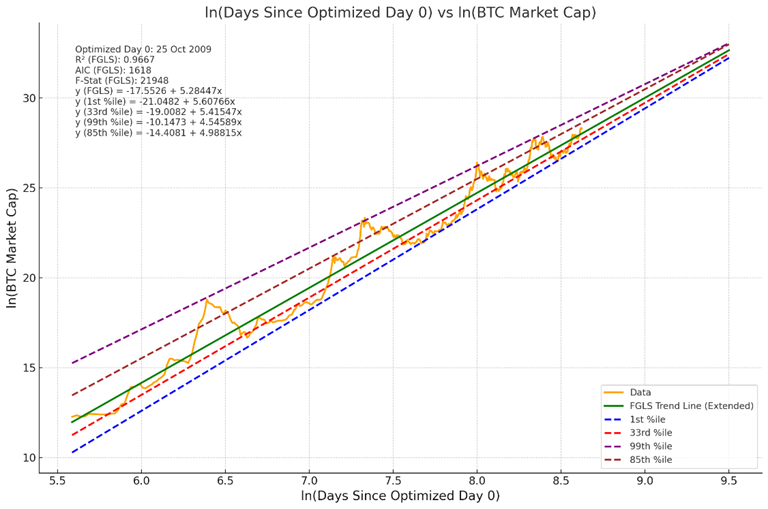
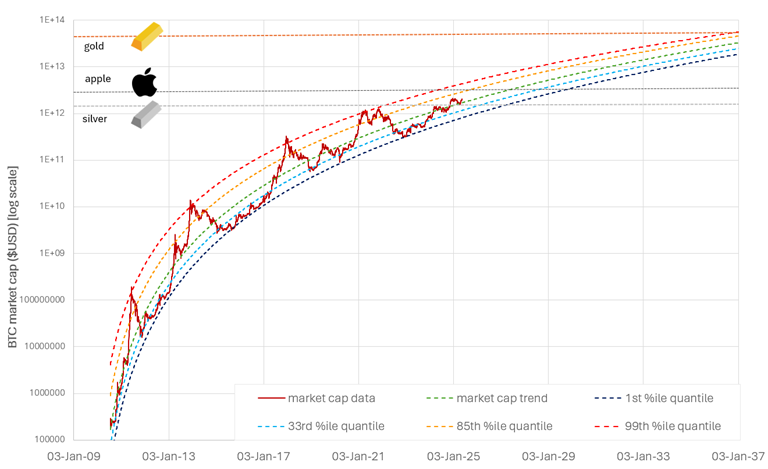
We can plot the quantile regression lines on the chart to indicate the ranges Bitcoin will likely follow. Notice how the volatility compresses as time passes, meaning the swings and drawdowns will be less extreme.
The chart below shows what this looks like when we return to the normal time and price scales. Notice how we’re just above the long-term trend with the 1st percentile quantile “support” at $41k and the 99th percentile at $220k. Based on previous cycle behaviour, if Bitcoin were to reach the 99th percentile projection by November, the price could hit around $255k.
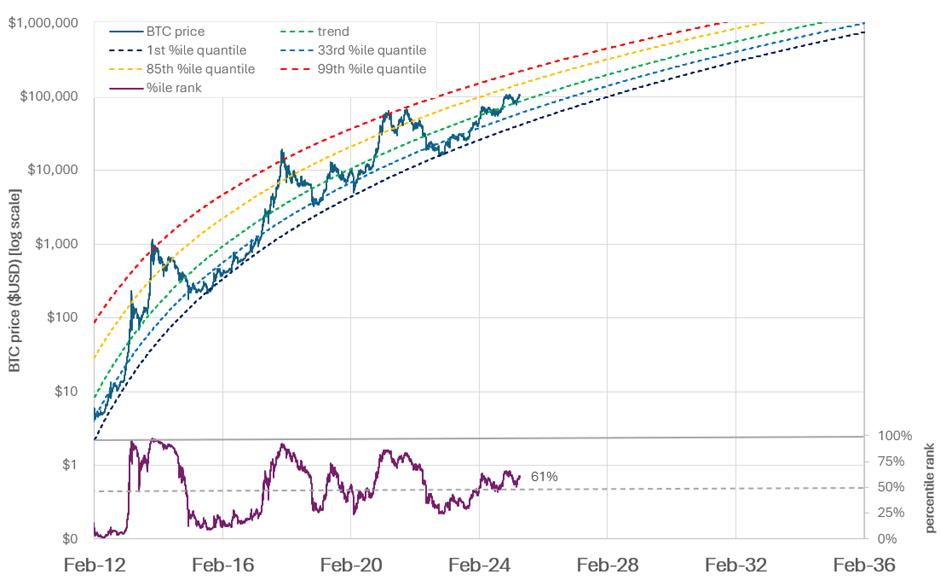
But if we continue the power law trend, we’ll hit $1m USD per bitcoin in 2034. This gives long-term holders confidence to hold through the drawdowns, knowing that Bitcoin will win in the long term. We’re currently just above the long-term power law trend at the 61st percentile.
The power law trajectory shows us that it won’t be long before the Bitcoin market cap overtakes all companies and eventually gold.
Yes, Bitcoin’s Returns Are Shrinking
The big reason most people object to the power law is that it predicts diminishing annual returns.
As shown in the chart below, if you’d bought Bitcoin in 2011, you would have an average of 100% per year. But the reality is that not many people put a lot of money into Bitcoin back then, and if they did, they didn’t hold onto it because they couldn’t stomach the extreme volatility.
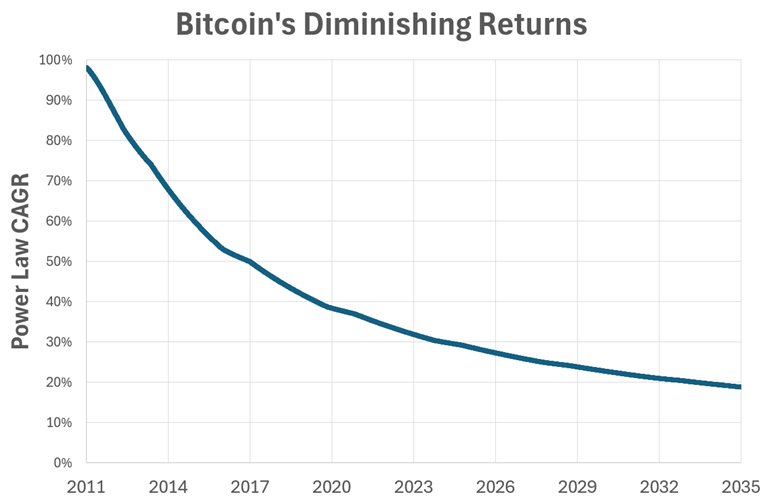
Right now, the power law grows at 31% per year, which is way better than any other available investment. The current log-log trajectory forecasts that this will decrease to around 19% in a decade.
While this is less than some people might hope for, the good news is that there is less volatility as Bitcoin grows into a larger market cap. While there is still tons of speculation, big companies and countries are less likely to trade it or short it.
Today, many who believe in Bitcoin but want higher returns invest in leveraged Bitcoin equities like Strategy, MetaPlanet, or The Blockchain group while saving in Bitcoin.
The Evolving Power Law: Still Reliable, Still Rising
Many people think that the EFTs, Strategic Bitcoin Reserve, leveraged bitcoin equities, and sovereign wealth funds will blow the price of BTC through the roof overnight.
But the reality is that, as market cap growth, these bigger players are necessary to keep up with the power law trend growth rate of $1.6b per day. This is a million times more than Bitcoin's entire market cap on the first day we have data for (i.e. 18 July 2010).
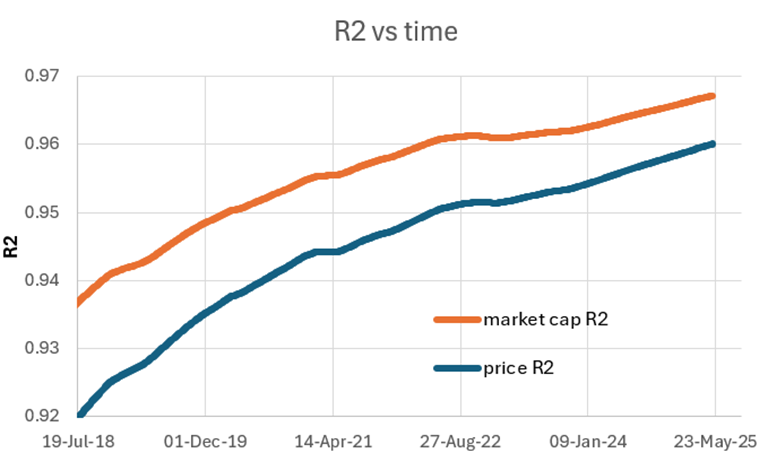
Most people consider the Bitcoin power law to be ‘broken’ if the R2 drops below 0.9, but as shown in the chart below, the R2 strengthens with time as we obtain more price data. The R2 for Bitcoin’s market cap is currently above 0.96!
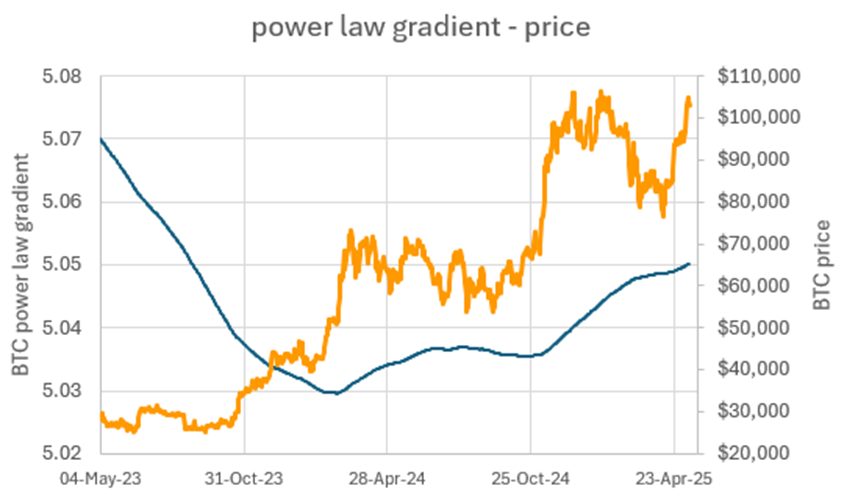
The power law gradient dynamically adapts to recent price data. Since the announcement of the ETFs in late 2024, the slope of the power law has increased, reflecting faster adoption and capital inflow.
Will the Power Law Break? Only if the Dollar Does
Over the past 12 years, the global money supply (M2) has grown at a CAGR of 5.4%.
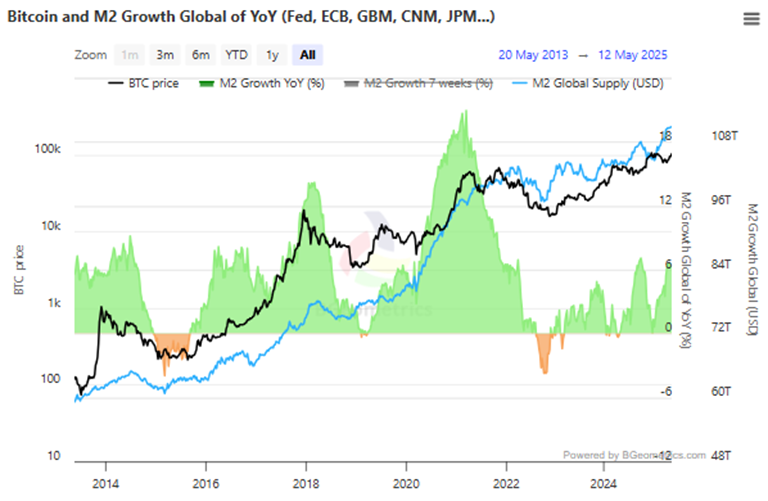
Notice how the BTC cycles correlate with the money supply. BTC has absorbed increases in global liquidity, such as the post-COVID quantitative easing. Since 2021, governments have been trying to dial back the money supply, but eventually, they’ll need to increase it again, and the cycle will repeat, and BTC will continue to win.
But to reach a $1m USD bitcoin in the next couple of years, we would need a massive dilution of the USD, similar to what happened to smaller countries and the German Mark after the financial penalties applied to Germany after WWI (a significant trigger for WWII).

We’re undoubtedly heading in that direction, with all currencies suffering from increasing inflation. But it will probably not happen overnight, at least to the USD to an extent that the power law won’t be able to adapt.
Right now, to maintain reserve currency status, it seems that the US is moving towards backing its dollar with Bitcoin with a layer of stablecoins for transactions.
While many Bitcoiners dream of Bitcoin going to the moon overnight, if it does, it will likely crash again as all the traders take profits and short it. The best outcome for Bitcoiners is for Bitcoin to grind up against the USD without the extremes that have led to the 70-80% drawdowns in the past.
Rather than getting rekt trying time and trade Bitcoin, the insights from the power law give us confidence that we have pristine collateral that will only continue to grow over the long term.
Key Takeaways
· Bitcoin follows a power law trend when plotted on a log-log scale, offering a reliable view of long-term price growth despite short-term volatility.
· Optimising the model’s start date (e.g., 2 August 2009) improves the statistical fit, accurately reflecting Bitcoin’s price trajectory.
· Quantile regression shows predictable cycles, with Bitcoin often oscillating between extreme highs and lows around the central trend—helpful for setting realistic long-term expectations.
· The power law is dynamic, adapting to new data and reflecting a robust 31% annualised growth rate, outperforming most asset classes.
· Breakdown scenarios (like a $1M BTC) would likely require significant devaluation of the US dollar, rather than a sudden surge in demand alone.
· Sustainable growth, not hype-driven spikes, is Bitcoin's healthiest path forward, avoiding the harsh drawdowns of past cycles.
What do you think? Have you used the power law to guide your Bitcoin strategy, or are you sceptical? Drop a comment and let’s discuss.