Rocket Fuel or Vapour? What the Shape of BTC Growth Tells Us for BTC-TCs


People love watching rocket launches.
Why?
Because you never really know what's going to happen — will they soar to the moon, drift aimlessly, or explode on the launch pad?
The same goes for Bitcoin treasury companies (BTC-TCs). Early excitement is thrilling, but it’s what happens after takeoff that really matters.
At first, everything looks like exponential liftoff.
But over time, trajectories diverge. Some BTC-TCs hit escape velocity. Others stall. And eventually, all must reckon with the limits of fuel — or, in this case, capital.
So, how do we figure out which rockets still have fuel in the tank — and which are about to lose their battle with gravity?
That’s where growth trajectory modelling comes in.
Charting the Climb
Getting rapid feedback on X is great.
When I first started sharing and posting the Bitcoin Stacking Race chart, a lot of people loved it, but astute observers called BS on the exponential trend lines.
Regardless of their current trajectory, MetaPlanet are unlikely to overtake Strategy by early 2026.
And then there are all the companies that are on track to buy ALL the bitcoin, based on a simple exponential trend line in short order:
· MetaPlanet – 9 December 28
· ALTBG – 19 Nov 2026
· H100 - 24 December 2025
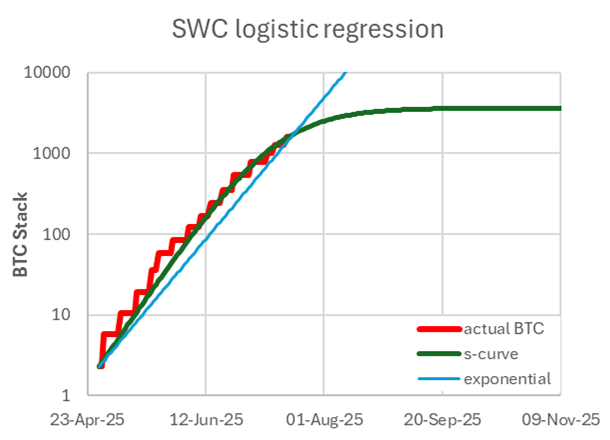
· SWC – 13 November 2025
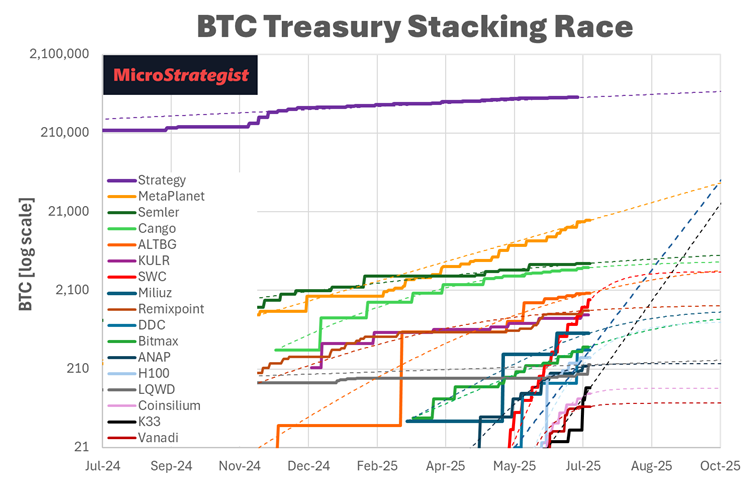
This exponential growth has to slow, but when?
Trajectory Is Destiny
Understanding where your BTC-TC’s BTC stack is headed is not just fun, like cheering for your favourite sports team.
BTC growth is everything.
While bitcoin may be forever, you don’t have to pledge until death do us part to your favourite new BTC-TC.
Investors pay a premium for BTC Yield (growth in BTC per share), and once that drops, the mNAV premium implodes.
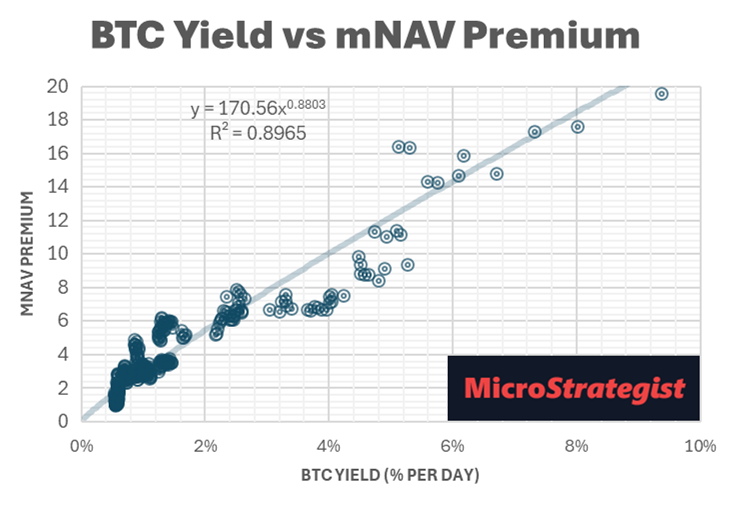
If you’ve boarded a rocket that suddenly runs out of gas not too long after launch, you’re in trouble! The mNAV that fuels these companies is a double-edged sword!
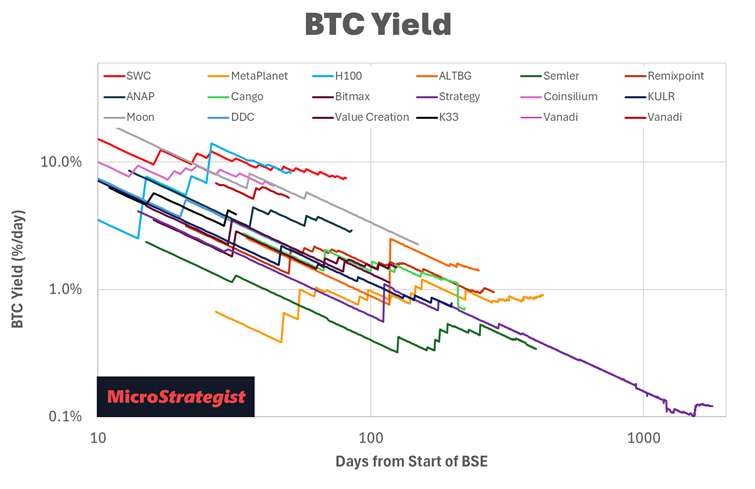
Astute investors will want to see a consistent track record of sustainable BTC Yield with regular BTC purchase announcements. Many investors will pull the ripcord at the first sign of BC Yield slowing, leaving the die-hards holding the bag.
If mNAV compression happens faster than BTC rises, the share price is headed south.
Fine-Tuning the Forecast: Why Shape Matters
I was excited to add the logistic (S-curve) regression, which helps us project a company’s future BTC stack based on its current trajectory.
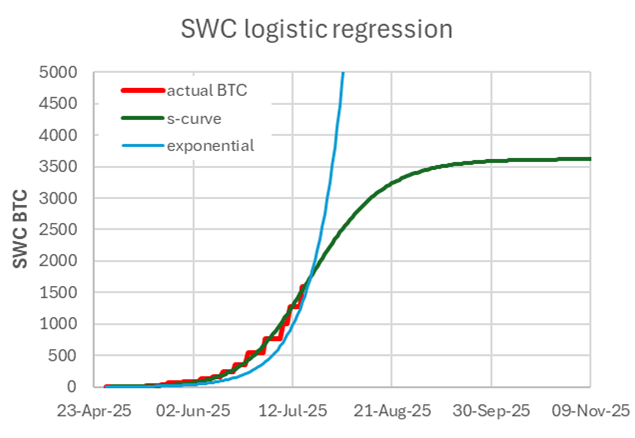
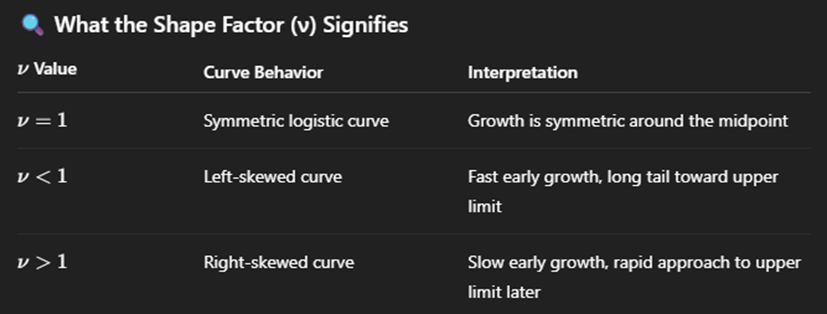
However, I received a ton of ‘constructive feedback’ from the SWC community, so I dug a bit deeper and discovered the generalised logistic functions (aka ‘Richard’s regression’), which adds a shape factor to the logistic regression and gets a better fit with the existing data.
The key aspect here is that the shape factor helps us identify a company that is either front-loading or back-loading its growth. A company that is pumping its stack with early IPO investor funding will have a lower ‘shape factor’ (v), while a company that has organic initial growth.
Late Bloomer vs Mini Rockets
I know this is getting a bit nerdy, but I think the detail is helpful.
The table below shows the results of the regression analysis, sorted by the shape factor. The same factor is calculated as part of the regression analysis, optimised to maximise R2.
These metrics help forecast which BTC-TCs might flame out vs. those with staying power.