Stacking Velocity & Market Signals: The Next Phase of the Bitcoin Treasury Boom


While headlines churn and noise rises, we stay focused on the metrics that matter — stacking velocity, fair value signals, and emerging leaders.
This week’s update brings sharper models, new contenders, and key insights into which companies are accelerating their BTC per share… and which ones risk being left behind.
Bitcoin — Still Above the Power Curve
Bitcoin continues to cruise along above the power law trend line. It’s currently getting a little warm, but far from overheated at the 64th percentile after a slight pullback from its recent all-time high.
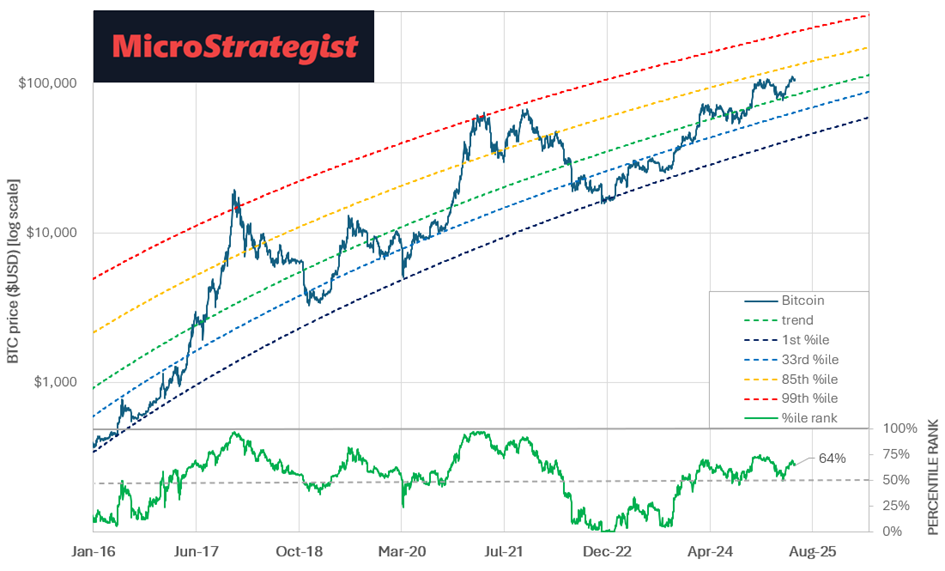
With changing economic conditions and bitcoin treasuries snapping up large quantities of bitcoin, perhaps the four-year cycles are a thing of the past, and we will see a more stable upward trend over the next few years.
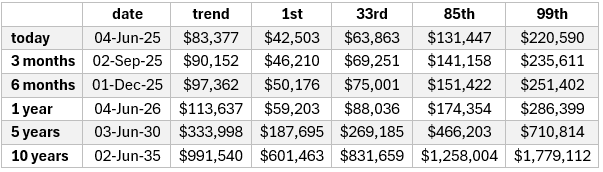
Everyone wants to know what price Bitcoin will reach, so the table below shows the power law trend values, along with the 1st, 33rd, 85th, and 99th percentile quantiles. While it’s impossible to predict the short-term bumps in BTC, fortune will favour those with a low time preference.
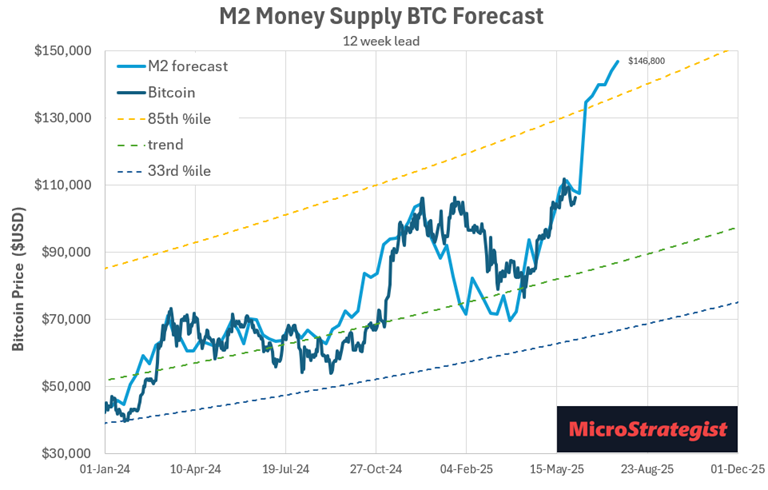
M2 Signals Flash Green — What’s Next for BTC?
Many people have been monitoring the correlation between M2 and Bitcoin lately. As shown in the chart below, if we move the M2 money supply 12 weeks ahead, the model implies a potential move toward $147K, assuming the historical M2 relationship holds. But remember, there are no certainties, only probabilities and models that help you manage your risks.
Stack Speed Rankings — Who’s Outpacing the Market?
If you hadn’t already noticed, things are getting pretty hectic in the world of Bitcoin treasury companies.
The DTC mNAV metric helps us understand which BTC treasury companies are earning their premium by stacking BTC as fast as possible. Smaller companies initially grow their BTC per share at an exponential rate. However, eventually, because there is only a finite amount of bitcoin and pools of capital are limited, this rate must slow, causing the mNAV to drop, and the share price to follow.
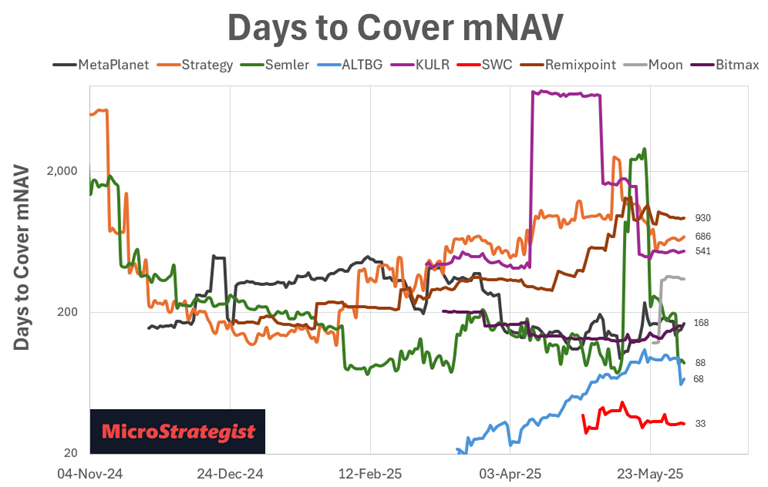
This week, we’ve added Remixpoint (3825.T), Moon (aka HK Asia Holdings) (1723.HK), and Bitmax (377030.KQ) to our Days to Cover mNAV chart. To make the cut, the company must have at least three bitcoin purchases with increasing BTC/share.
· The Smarter Web company remains the standout performer, boasting a BTC Yield of 9.7% per day.
· ALTBG’s DTC mNAV plummeted after increasing their BTC stack by 74% in one hit!
· Semler currently has a super low mNAV of 1.24, so their DTC mNAV is super low at 88 days, ahead of MetaPlanet at 168 days.
BTC Treasury Race — Who’s Pulling Ahead?
The corporate BTC stacking race continues to accelerate.
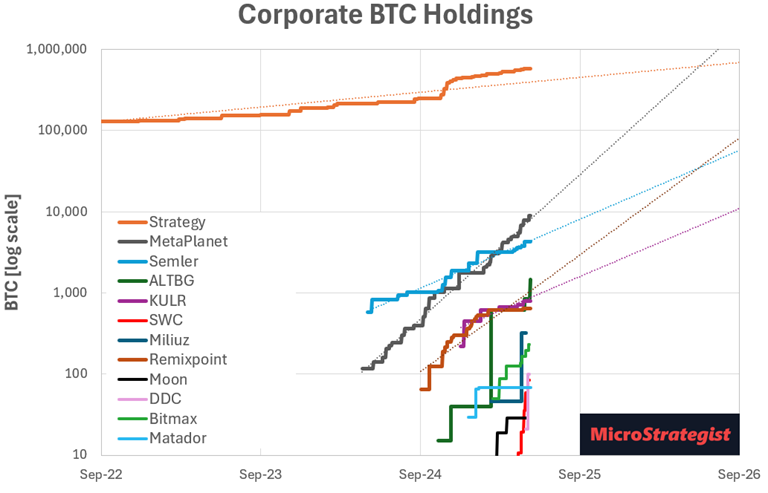
Companies that can stay above the exponential trend line (linear on a log chart) are the ones that will become the new contenders, while the others will fall behind and become the also-rans. While MSTR remains above its long-term trend and will likely always have the largest stack, smaller companies can grow faster and steal the limelight, providing a higher BTC Yield.
Buy the Dip or Wait It Out? What Fair Value Charts Say
While the Days to Cover mNAV charts help us understand which companies are stacking the fastest and earning their premium, the fair value charts help us know which ones are falling out of favour and may be a good buy relative to their long-term trend.
· Fair value is based on the long-term relationship between BTC value per share and its share price.
· The fair value percentile rank helps us understand where their current price is sitting relative to their typical range.
· The projected values are based on their current BTC Yield and a conservative 30% CAGR for BTC (per the power law).
Strategy (MSTR): Underpriced Giant or Slowing Titan?
Speaking of slowing growth, with a lower BTC Yield compared to some of the smaller BTC Treasury companies (0.16% per day), Strategy’s mNAV premium has fallen recently. As shown in the chart below, the MSTR share price is currently sitting at the 16th percentile, solidly in the oversold zone.
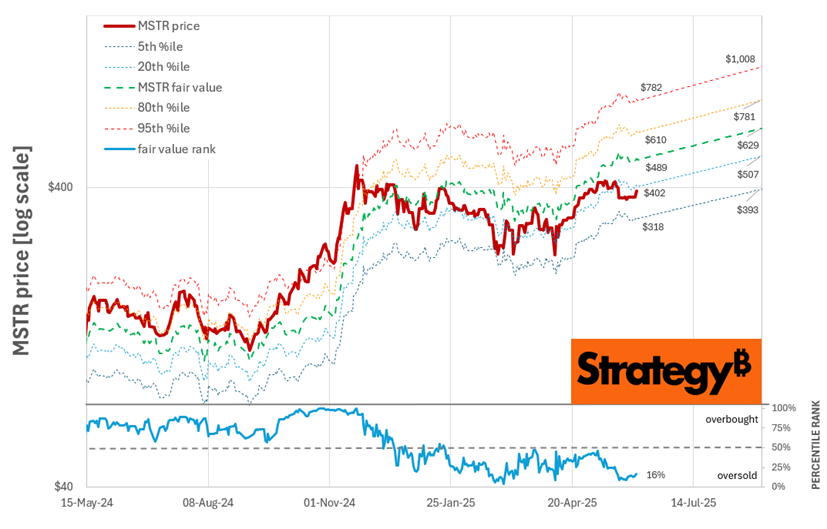
If we continue to see power-law growth in Bitcoin and the current BTC yield, Strategy should provide some solid returns over the next few months, although possibly less than those of smaller, more volatile BTC treasury companies.
Upcoming catalysts for MSTR include tapping into the STRF and STRK preferred ATM and future S&P inclusion, both of which could enable them to increase their BTC Yield and hence their share price. They also announced a new preferred share (STRD), allowing them to rely less on the ATM for common stock and maintain a higher mNAV.
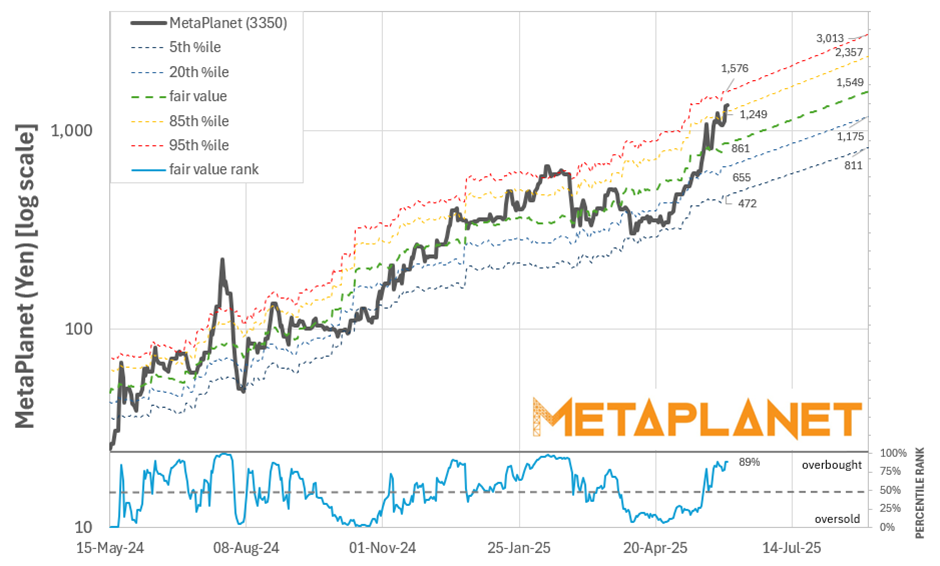
MetaPlanet Mania — Still Room to Run?
Similar to MSTR back in October, MetaPlanet is the hot new BTC Treasury that everyone is talking about. While currently in the overbought zone, given its strong retail following and recent returns, MetaPlanet still has room to run, assuming the current pace continues.
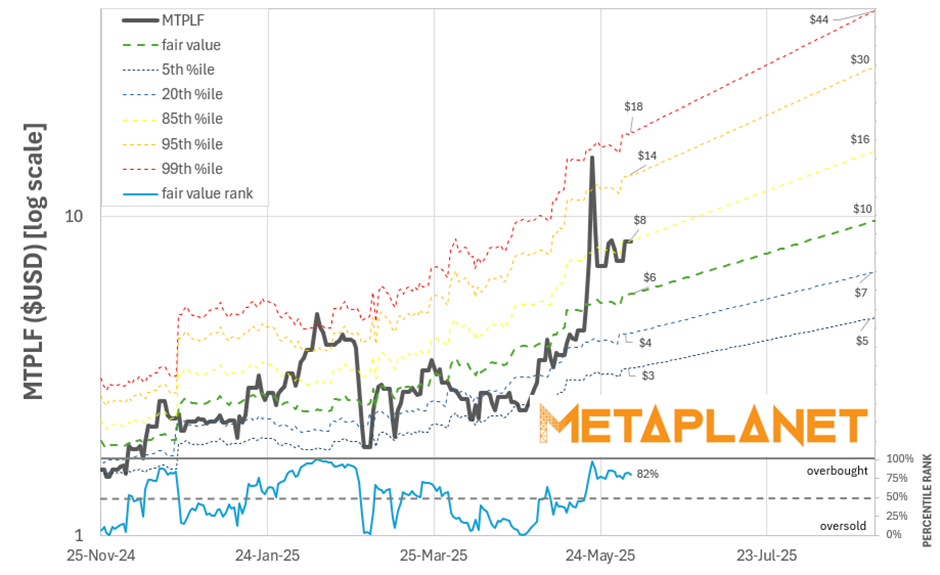
Similarly, the US ticker, MTPLF, has pulled back from extreme levels to the 81st percentile of the fair value range but has plenty of room to run over the next few months.
Semler’s Comeback? Quiet Moves with Big Potential
With an mNAV of 1.23 and renewed BTC buying bringing their BTC Yield up to 0.115% per day, Semler is looking like it might make a comeback with a competitive DTC mNAV of 88.
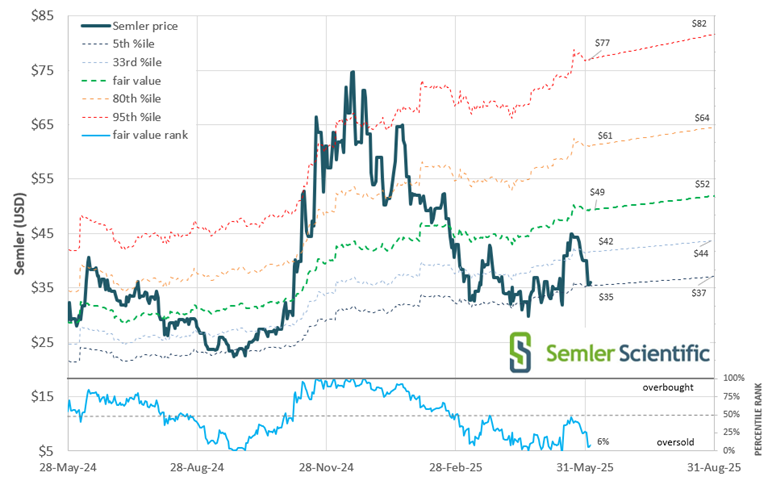
The one thing that Semler seems to be missing is a loyal following and hype crew, but that might change in the coming months with Natalie Brunell joining the board.
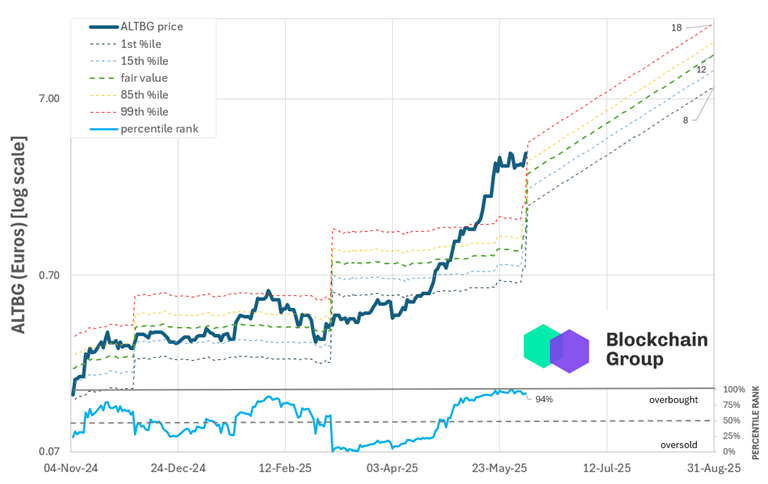
ALTBG: Fast Stack, High Stakes
While they’ve only made a handful of bitcoin buys, The Blockchain Group (ALTBG) are currently sitting on a massive BTC Yield of 2.67% per day after recently increasing their stack to 1471 BTC.
Although they’re currently sitting at the top of the overbought range based on their fair value, there’s a good chance their share price will be a lot higher in a few months, led by Alexandre Laizet, who is executing aggressively, acutely aware that maintaining BTC/share growth is vital for survival.
SWC’s Blazing Start — Can It Keep Up the Pace?
Finally, the Smarter Web Company have only been trading for a little over a month, but their stacking rate (so far) is relentless, at an incredible 9.7% per day. Despite their mNAV of 22, this gives them a phenomenal DTC mNAV of 34!
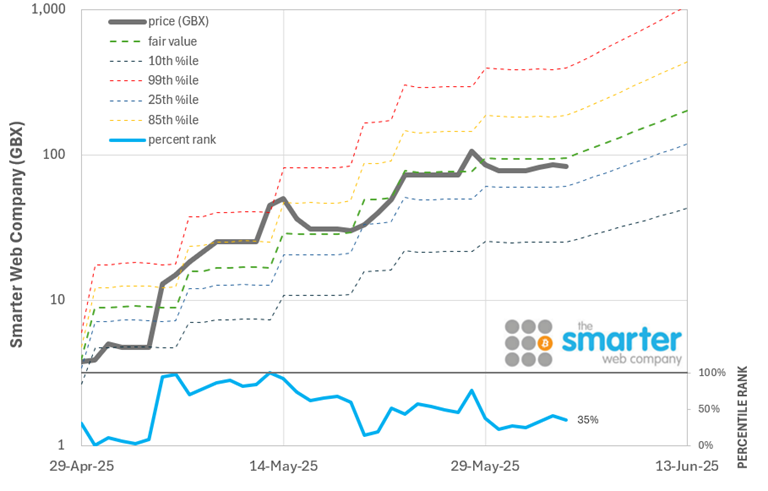
This has to slow down eventually, but right now, their fair value percentile rank is sitting at 35%, and their share price is rising like a rocket!
Stacking Smart — How to Allocate in This BTC Arms Race
While all the data and charts are interesting, the real question is how we should allocate our capital among the contenders in the race to stack as much BTC as fast as possible.
· The fair value charts help us understand where they are in their current cycle compared to their long-term trend, ensuring we don’t buy in when things are overheated.
· Meanwhile, the Days to Cover mNAV charts help us identify which companies have the most raw power to keep their stack and, consequently, their share price.