The Great Bitcoin Stacking Race: Who’s Leading and What’s Next?

Get ready to dive into the rapidly evolving world of companies stacking Bitcoin at breakneck speed!
In this first edition of the MicroStrategist newsletter, we’ll decode what’s driving the biggest Bitcoin accumulators, highlight new contenders turning heads, and reveal how to spot the next fastest horse.
Whether you’re an investor, a Bitcoin believer, or just curious about how this digital gold rush is evolving, this update has the data and insights you need to stay ahead of the curve.
This Week’s Highlights
· Bitcoin is holding strong above its long-term trend at the 67th percentile, with $256k possible by November if cycles repeat.
· MetaPlanet’s meteoric rise continues, fueled by Japanese demand and aggressive BTC stacking.
· Strategy and Semler are consolidating, while newcomers like ALTBG are making bold moves.
· Days to Cover mNAV and fair value ranges highlight the most aggressive BTC equity opportunities right now.
· Projected annual returns (CAGR) show MetaPlanet may be due for a cooldown, while ALTBG’s potential if it keeps stacking is explosive.
Bitcoin – The Big Picture: Above Trend, Below Euphoria
The fate of the Bitcoin equities that many are calling ‘the memecoins of this cycle’ is intimately tied to the fate of Bitcoin. So, before we dive into the individual equities, let’s look at the big picture Bitcoin trends.
Bitcoin remains above the long-term power law trend, currently at the 67th percentile. However, this is below the exuberance we reached at the all-time high (ATH) after the US election in November (73rd percentile) and significantly below the upper quantile that Bitcoin historically struggles to penetrate, at least for a prolonged period.
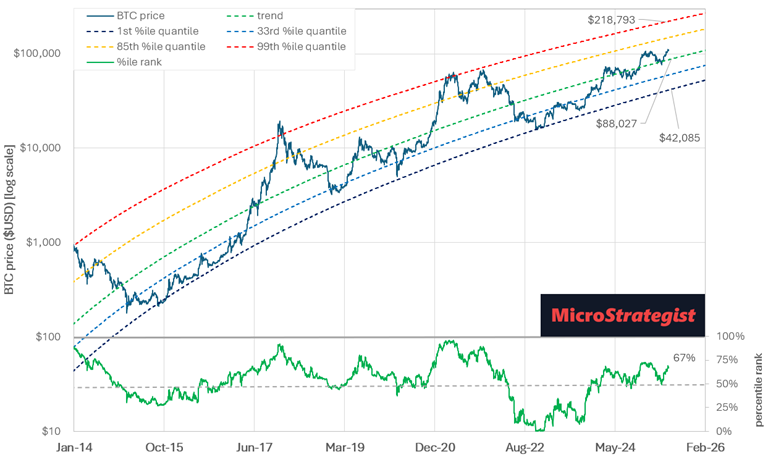
If history repeats and we follow previous cycles, we could see Bitcoin at $256k later this year. However, as we’ve seen, elections, tariffs, and liquidity tend to dominate rather than the four-year halving cycles. It’s impossible to predict where Bitcoin will go in the short term.
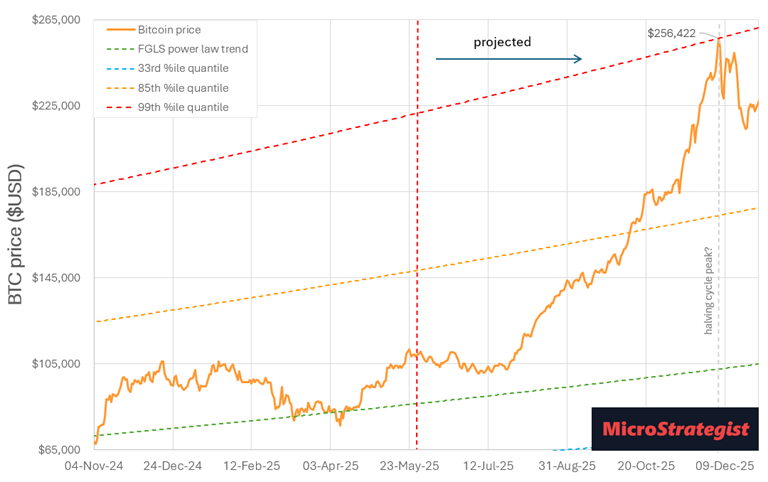
Recent macroeconomic events appear to have pushed the liquidity cycle back. With company treasuries and national state uptake, we may see a slower super cycle that grinds up rather than an exponential pump and dump.
There is no certainty. All we have are models and probabilities. Always remember, “All models are wrong, but some are useful” (George Box).
The Bitcoin Stacking Race: Who’s Gaining Ground?
The Bitcoin gold rush race is on, with several smaller companies following Strategy’s playbook aggressively.
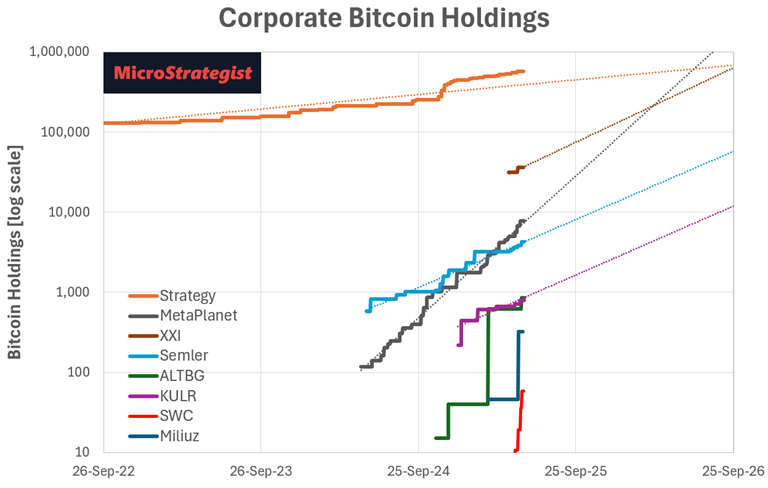
· Strategy just purchased an additional 4020 BTC, with more funds coming from the preferred shares rather than the ATM.
· MetaPlanet have been relentlessly stacking, keeping up with the exponential trend line!
· Meanwhile, Semler and Kuhler have recently resumed their BTC purchases.
· Coming from behind, The Blockchain Group, Miliuz and The Smarter Web Company are growing quickly from a much smaller base, which, as you’ll see, gives them an advantage when it comes to the all-important increase in BTC per share (aka BTC Yield).
Days to Cover mNAV: Decoding the Key Metric
The Days to Cover mNAV, inspired by Adam Back, has gained a lot of attention recently. It elucidates the relationship between BTC Yield and the mNAV premium, helping us understand how long it will take for the mNAV to be paid off at the current BTC Yield.
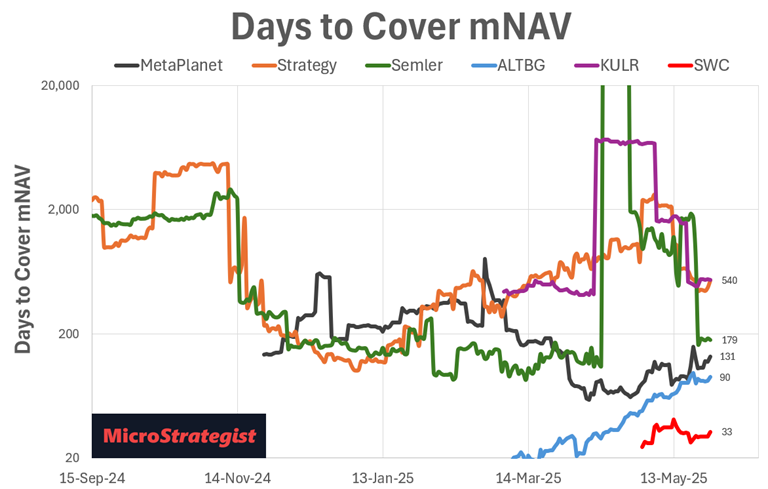
· Strategy, Semler and KULR have brought their DTC mNAV back down since BTC recovered from its recent lows.
· MetaPlanet has managed to maintain a very respectable DTC mNAV for the past year, other than a few times when their share price peaked.
· Meanwhile, the price of ALTBG (in France) and SWC (in the UK) have exploded due to their rapid growth in BTC per share and hence low DTC mNAV.
The table below shows the current BTC stack, mNAV, daily BTC Yield (%/day) and DTC mNAV for the contenders in the BTC stacking race.

If DTC mNAV was the only factor you wanted to consider, the bottom row of the table and the chart below show a possible portfolio weighting to chase the fastest-growing companies. Of course, other factors are at play, like debt, market cap, BTC held, stability, track record, etc, but this should give you a starting point for an aggressive speculative but diversified BTC equity portfolio.
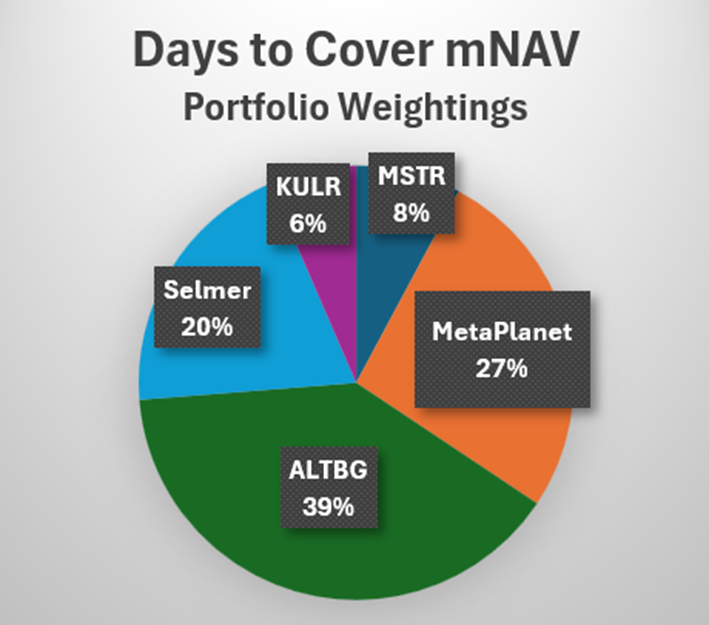
As highlighted in our previous article, if you’d been lucky enough to follow this system over the past year, you would have seen a 100x (excluding tax and trading fees) as you rotated some of your funds to the newer contenders starting to prove themselves.
Fair Value Charts: Your Guide to Entry and Exit Points
While the DTC mNAV is based on the short-term BTC Yield, the fair value charts help us understand where an equity is in its medium-term cycle and the normal price range for the current BTC per share.
The ‘fair value’ is calculated based on the long-term historical relationship between the bitcoin value per share and the share price. The percentile lines are like guardrails, indicating the range that price is likely to stay within based on a company’s BTC per share and BTC value. For example, we would only expect it to fall below the 5th percentile 5% of the time and above the 95th percentile 5% of the time.
The fair value projection is based on the current daily BTC Yield for that company (shown in the table above) and a conservative power-law bitcoin growth rate of 30% per annum.
As you can see from the percentile rank line at the bottom of each chart, markets move in cycles, from the bottom of the fair value range to the top and back again, depending on sentiment around the stock. So, if you’re willing to be patient, the fair value range can help you time your entries or even place laddered buy or sell orders and wait for the price to come to you.
MSTR: Oversold and Ready for a Bounce?
With newer and shinier options available, MSTR has taken a bit of a beating lately despite the BTC all-time highs.
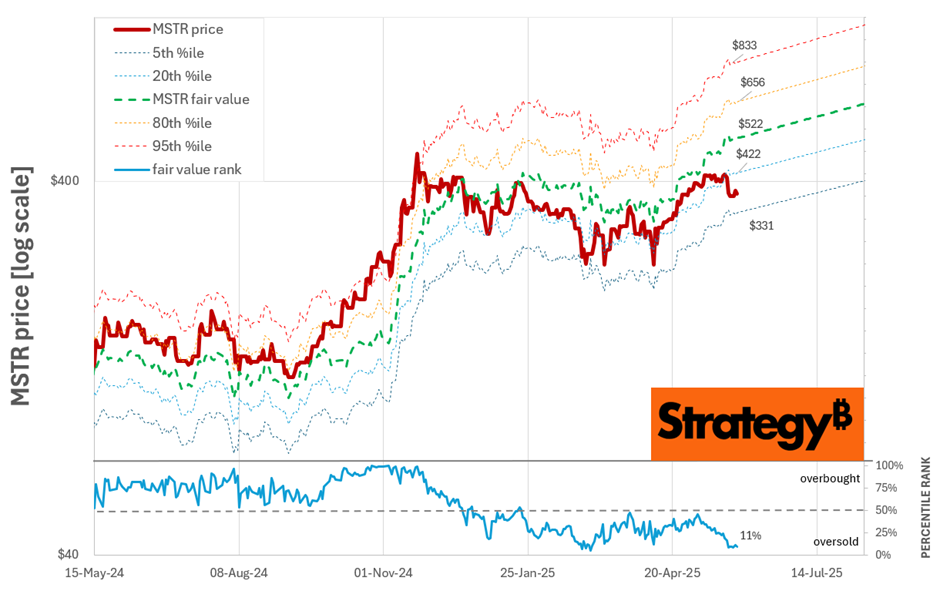
MSTR is currently sitting in the oversold zone at the 11th percentile. Based on the fair value analysis and the long-term power law trend, MSTR looks pretty cheap right now. However, the current price slump could also be due to other bitcoin equity companies offering a higher BTC yield (and hence lower DTC mNAV), so we may not see a significant bounce until they approach S&P inclusion (hopefully later this year). The fact that Strategy have built what is likely an uncatchable BTC stack shouldn’t be taken lightly.
MetaPlanet’s Moon Mission: Can It Keep Up?
Meanwhile, at the other end of the spectrum, MetaPlanet has been having a great run, fueled by aggressive Bitcoin buying and the Japanese using it to escape their poor financial situation and sidestep the high taxes on Bitcoin ownership. It’s been limit-up for multiple days on the TSE and is currently sitting at its 85th percentile relative to fair value.
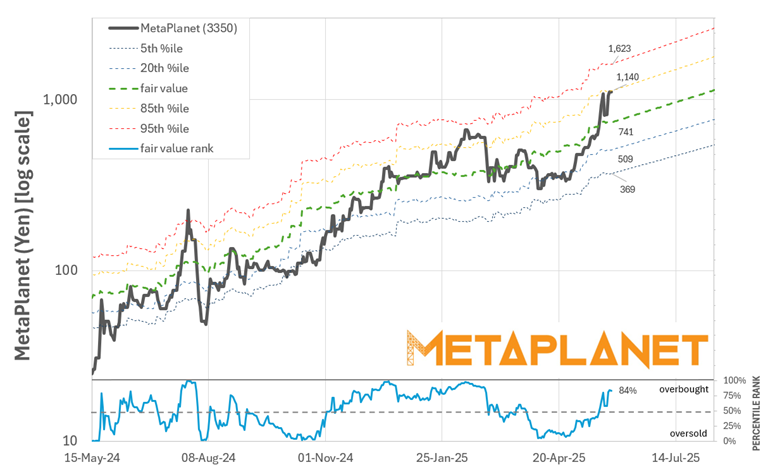
MTPLF punched through the 99th percentile limit, peaking at $16, as MetaPlanet Madness hit the US, somewhat reminiscent of MSTR in November last year. Still, there’s no apparent reason that their winning streak won’t continue in the long term.
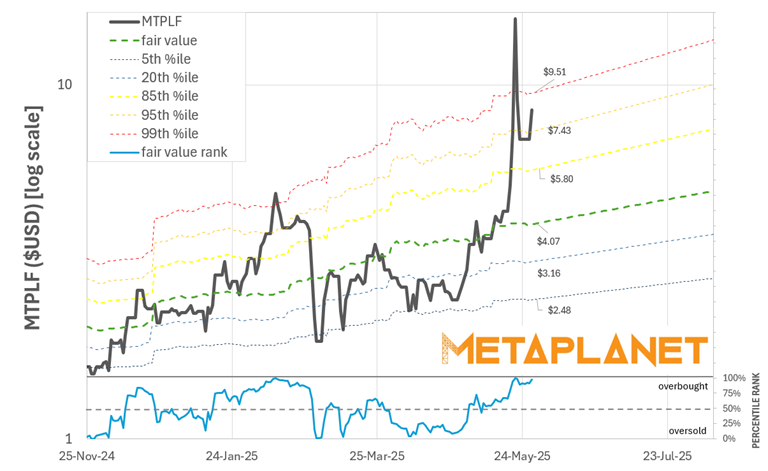
MetaPlanet’s high percentile suggests caution, but its fundamentals still support a bullish long-term outlook.
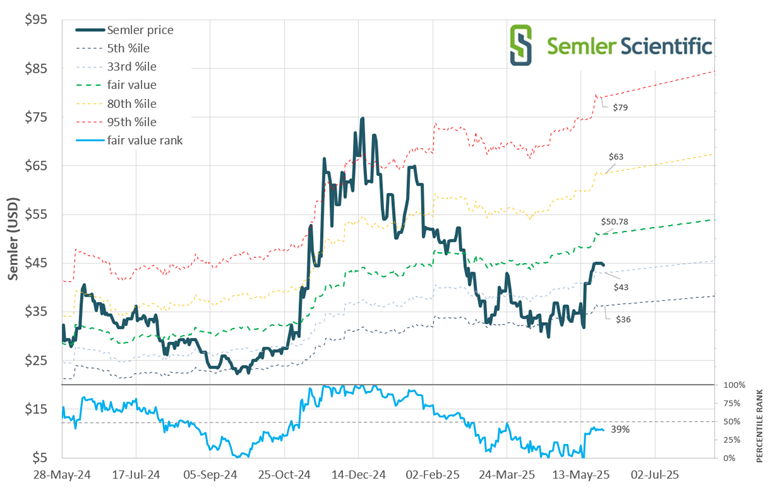
Semler’s Comeback: Back in the BTC Game
After settling its case with the DOJ, Semler is back in the bid for more Bitcoin, and its price popped accordingly. It is currently in the oversold zone, just below fair value, at the 38th percentile.
ALTBG: A New Challenger Emerges
The Blockchain Group has only made a handful of large purchases so far, so its fair value chart looks a bit bumpy. However, if it can continue stacking at this rate, it will continue to rip faces off with its vertical ascent, blowing MSTR and MetaPlanet’s previous records out of the water.
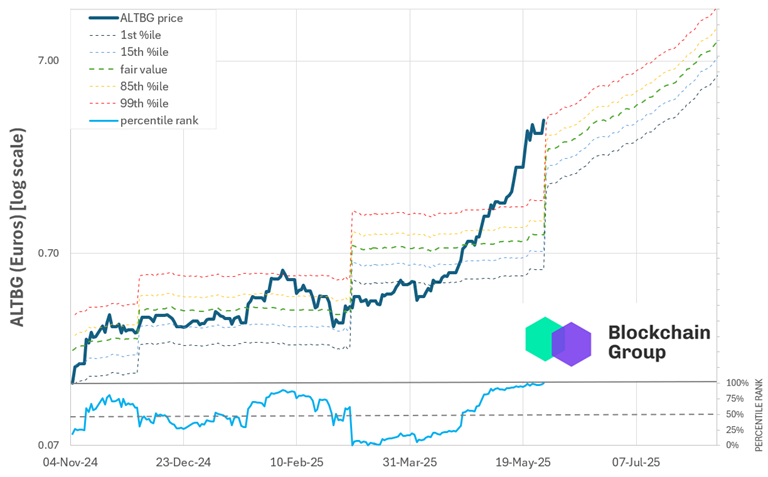
Based on their current track record, they appear to be serious about accumulating Bitcoin as quickly as possible, with an announcement yesterday that they had secured a convertible bond issuance to increase their BTC stack to an estimated 1,430.
It’s worth noting that ALTBG are currently at the top end of its fair value range, but investors seem to be pricing in a lot more aggressive buys in the future.
Who’s the Fastest Horse in the Bitcoin Race
With so many options popping up, many people wonder which company will be the next MSTR or MetaPlanet. To help you make sense of the options, the table below compares them, showing the current price versus the projected fair value price for 30, 90, and 180 days.
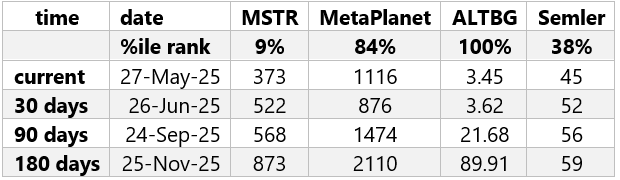
Note: This is not financial advice. It’s just math based on the assumptions outlined above.
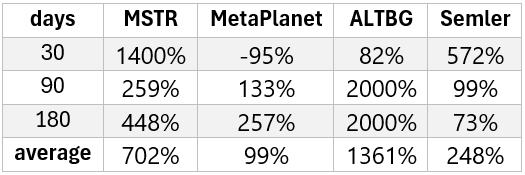
In the table below, I’ve converted it into a CAGR. I’ve limited these to 2000% so it doesn’t get too out of control.
● If we got some super bullish news (like definite S&P inclusion) and strategy popped up to the fair value line in 30 days, that would be more than a 1400% p.a. return. But reaching the fair value line in 6 months would equate to a 450% p.a. CAGR.
● Meanwhile, MetaPlanet is currently way over the long-term fair value trend, so returning to the trend in 30 days would equate to a -95% return, but in six months, you’d be back at 275%.
● As you can see, the projected returns for ALTBG are pretty crazy, but that relies on them keeping up with their current stacking rate, while Semler’s returns are great but still somewhat sane.
· If we got some super bullish news (like definitely S&P inclusion) and strategy popped up to the fair value line in 30 days, that would be more than a 1400% p.a. return. But reaching the fair value line in 6 months would equate to a 450% p.a. CAGR.
Meanwhile, MetaPlanet is currently way over the long-term fair value trend, so returning to the trend in 30 days would equate to a -95% return, but in six months, you’d be back at 275%.
· As you can see, the projected returns for ALTBG are pretty crazy, but that relies on them keeping up with their current stacking rate, while Semler’s returns are great but still somewhat sane.
Final Takeaways: Your Move in the Stacking Race
The Bitcoin stacking race is in full swing, and the numbers show some wild swings and equally wild opportunities.
Whether you’re tracking MSTR’s big stack, MetaPlanet’s red-hot momentum, or the newcomers like ALTBG, there’s no shortage of data to help you spot the next big mover.
Going forward, we’re looking forward to providing regular weekly updates on these metrics for our MicoStrategist Pro subscribers, so we’d love your feedback. Let us know in the comments below what you found most useful or what you’d like to see us cover in the future.