The Half-Life of Bitcoin Treasury Companies

“It’s going up forever, Laura.” Michael Saylor
While this might be true for Bitcoin, Bitcoin treasury companies are different. They’re not Bitcoin.
Investors pay a premium for companies that can stack the fastest.
“It’s going up forever, Laura.” Michael Saylor
While this might be true for Bitcoin, Bitcoin treasury companies are different. They’re not Bitcoin.
Investors pay a premium for companies that can stack the fastest.
But as soon as their rate of stacking starts to slow, the mNAV (multiple of net asset value) premium implodes.
Poof! It’s gone.
If you happened to FOMO in at the top with a high mNAV, you’ve got a LOT of downside risk exposure.
As you’ll learn in this article, the faster it comes, the faster it will go.
The TL;DR:
· BTC-TCs that grow fastest early often burn out first.
· Logistic regression helps forecast BTC stack size and when BTC Yield will slow.
· Declining BTC Yield = falling mNAV = share price risk.
· Watch the half-life — it’s the tipping point.
From FOMO to Fundamentals: My BTC-TC Wake-Up Call
Like many others, I fell down the BTC-TC rabbit hole back in October last year, thanks to MSTR True North.
What MSTR was doing to raise capital and stack more Bitcoin faster and faster was fascinating. Back then, it looked like MSTR’s mNAV was going up forever.
Unfortunately, I was wrong. We can't just draw an exponential trend line through anything, willy-nilly!
Nine months later, my investment in MSTR is now finally in the green after holding on! The opportunity cost of holding onto Strategy while the share price went nowhere and mNAV impoded over the past 9 months is huge!
So what happened?
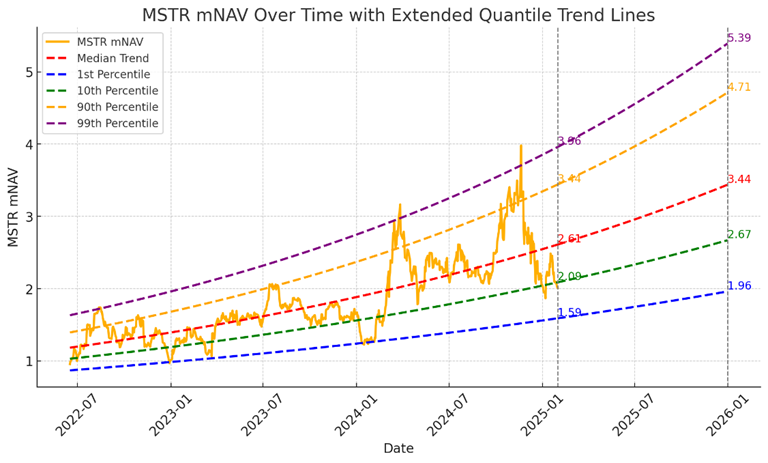
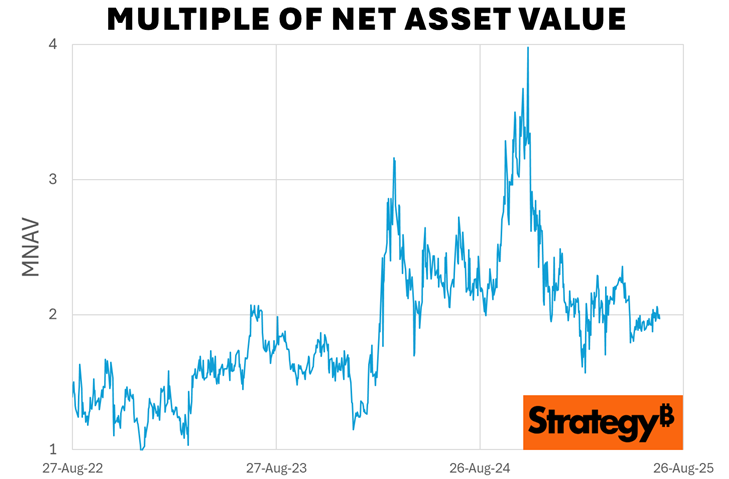
I now understand that Strategy pumped their BTC Yield with the ATM and convertible bonds before the election to levels they couldn’t sustain long term.
And when the BTC Yield (new BTC added divided by current BTC stack) slowed, the mNAV “tanked” from 4 to a low of 1.6.
After experiencing this, I’ve been super eager to understand it to make sure I don’t get burned again like that. But perhaps more importantly, I don’t want people reading my musings and analysis to get burned by excess hopium.
I wish someone had told me what I will unpack below, so I could understand how to manage risk when investing in BTC-TCs, especially when the typical mNAV today is much higher, leaving much more downside risk!
Mice, Whales, and Bitcoin Companies: A Survival Story
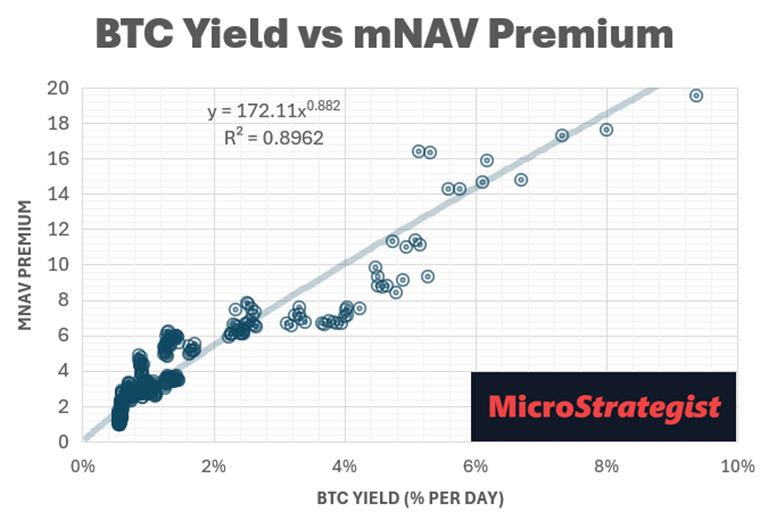
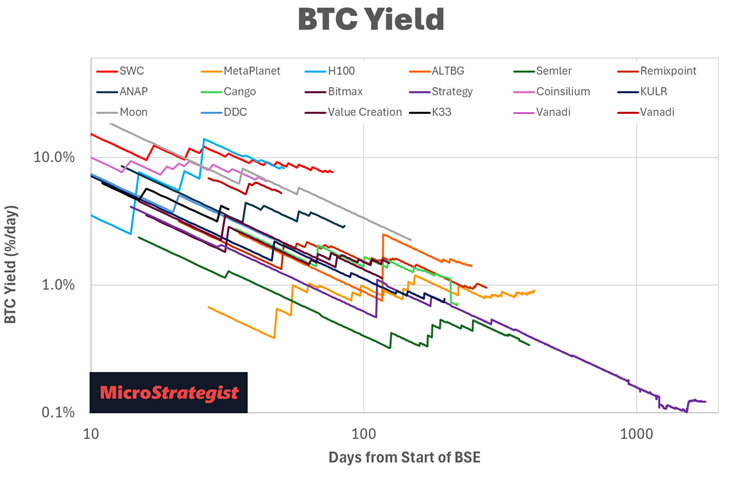
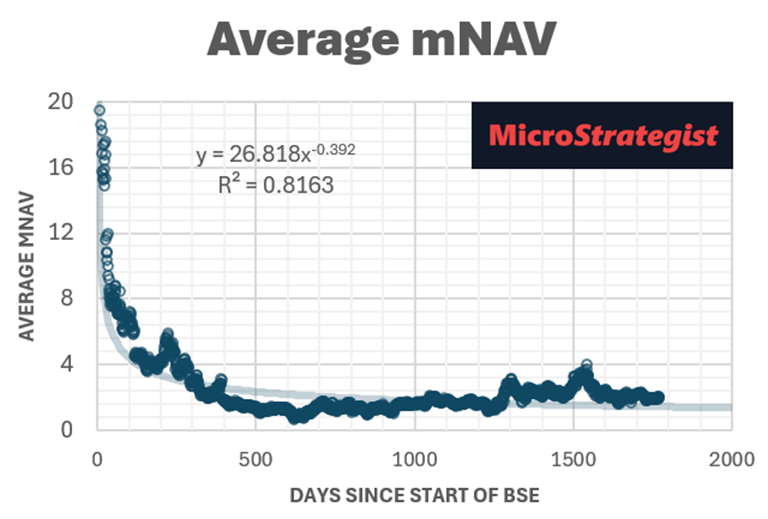
Since then, I’ve learned that, while Bitcoin tends to grow in line with a power law trend, mNAV premium and BTC Yield tend to decline in line with the power law
Note: “Power law” just means the trend becomes linear when plotted on a log-log chart.
Baby bitcoin companies can grow super quickly, but as they reach maturity, their growth slows.
A mouse grows to adulthood in just six weeks and may live 1-2 years, while a blue whale takes 10 years to grow to adulthood and can live for more than 90 years. The same principle appears to be true for BTC-TCs.

And just because an embryonic BTC-TC is injected with steroids (i.e. loads of early investment from venture capital funds), it won’t necessarily become the biggest fish in the sea. In fact, it may stunt its long-term growth.
As you’ll see, companies that grow the quickest are more likely to burn out early before reaching maturity. Once their growth stalls, mNAV will drop, and they will likely be eaten by the sharks and the whales who made it through this early stage.
I fear that many retail investors could be FOMOing in at the top, high on hopium and groupthink, believing their favourite BTC-TC will continue to go up like a rocket, only to become exit liquidity for the venture capital funds that bought in cheap at IPO.
Using Data to Spot the Peak Before the Fall?
Just like you try to predict how tall your child will be based on their early growth, by observing their growth trends, we can predict how big a BTC-TC might grow.
Lots of things in nature follow s-curve growth. We can only ever know the precise shape of the s-curve once it’s over, but we do know that a slowing of growth follows an initial exponential growth.
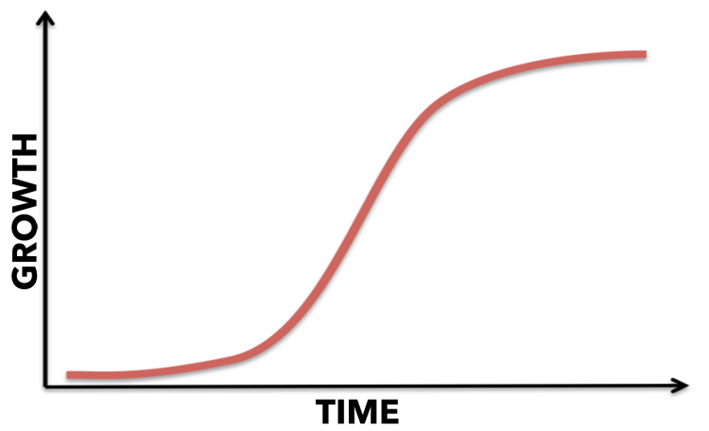
The halfway point where the growth starts to slow is the half-life.
The formula for modelling an S-curve is known as the logistic growth formula.
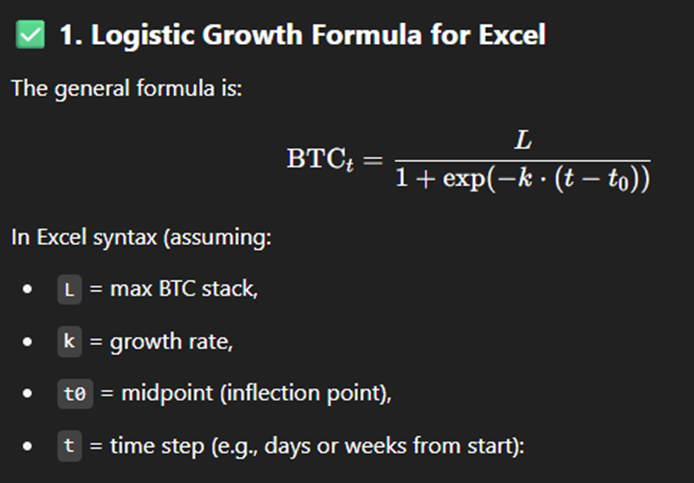
It can be fun to dream and model things with exponential projections. Unfortunately, no matter how much we believe and hope, exponential growth cannot continue indefinitely.
For example, the chart below shows that if the current exponential growth rate of 8.4% per day continues, SWC will own all 21 million BTC by 15 November 2025!
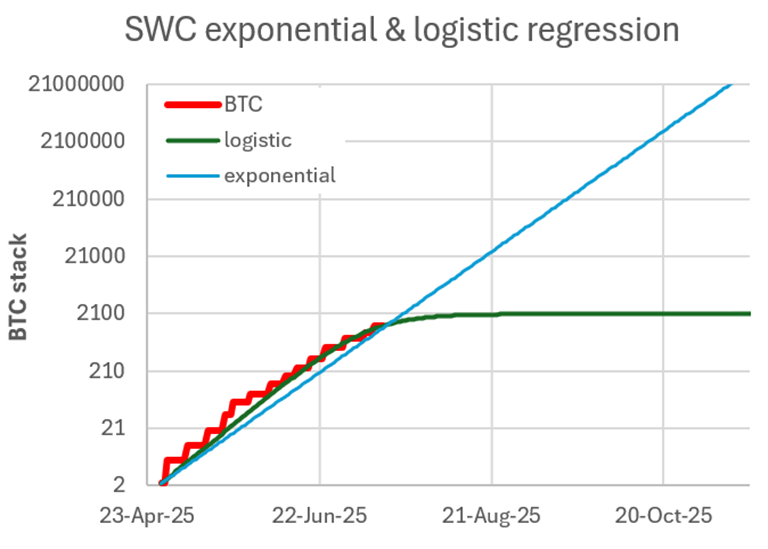
This is obviously nonsensical.
It has to slow down before then.
But when?