Unpacking mNAV: Why BTC Yield Matters Most

With our upcoming rebrand to mNAV.com imminent, it’s a perfect moment to unpack the question everyone in the Bitcoin Treasury Company (BTC-TC) space is wrestling with:
What really drives mNAV?
The answer isn’t as complicated as it might seem.
At its core, BTC Yield is the engine that powers BTC-TCs. Meanwhile, short- and medium-term momentum in Bitcoin’s price acts as amplifiers that shape how investors price these stocks in real time.
Understanding this interplay is critical — not just for explaining past moves in MSTR’s share price, but also for anticipating where mNAV might head next.
This article breaks down the data-driven signals, shows how they combine into a surprisingly robust model, and highlights what it all means for investors looking to ride the next wave in Bitcoin leverage plays.
The Signals Behind mNAV
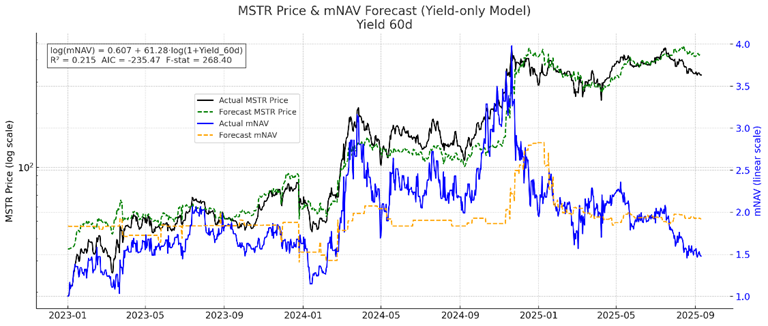
To jump to the punch line, the chart below shows actual vs. modelled MSTR price and mNAV using BTC Yield and momentum.
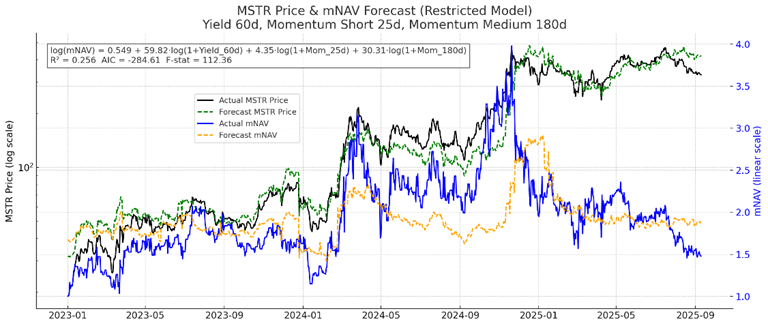
Of course, plenty of other factors influence daily price action — from macro liquidity swings to fear, uncertainty, and doubt (FUD) stirred up by short sellers like Jim Chanos. Yet when the noise clears, BTC Yield consistently emerges as the dominant driver. Importantly, our model currently suggests that MSTR is oversold.
No model is perfect, but the t-stat and p-values give us statistical confidence:
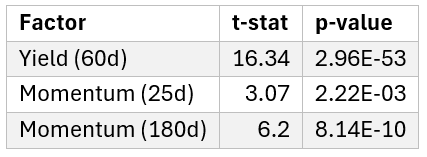
Let’s unpack each factor in more detail.
BTC Yield: The Heartbeat of mNAV
Just about everyone in the BTC-TC space agrees: BTC Yield is the most important KPI.
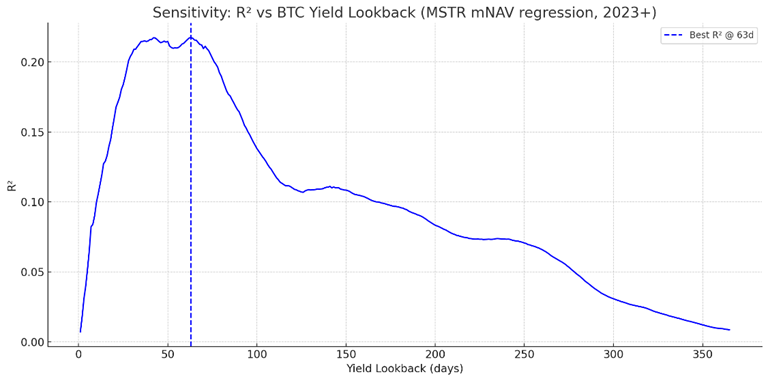
Yield measures the change in Bitcoin per share over a given period.
For MSTR, a 60-day lookback optimised the regression.
The chart below shows forecast mNAV based on BTC Yield alone. While this model holds up well, it also reveals a subtle lag: forecast mNAV tends to rise only after actual mNAV has already spiked. This dynamic was evident in October–November 2024, when enthusiasm around the U.S. election drove investors to load up on MSTR as a leveraged bet on Bitcoin.
At that time, Strategy was aggressively raising capital through convertible bonds and the ATM program, allowing it to buy BTC well above its historical pace. This caused BTC Yield — and mNAV — to surge. But once Bitcoin broke the $100k barrier and momentum faded, MSTR’s BTC Yield, mNAV and price declined.
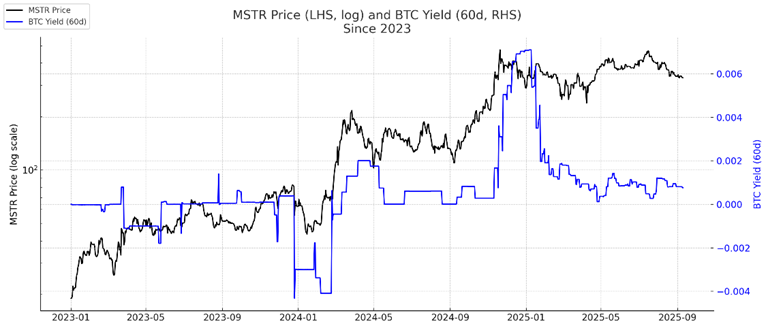
Now, BTC Yield has stabilised at more modest levels. Investors are no longer pricing in outsized future accumulation, and thus mNAV has normalised. By comparison, smaller BTC-TCs can achieve a much higher BTC Yield, but also come with a lot more volatility.
What Does This Mean for MSTR Price?
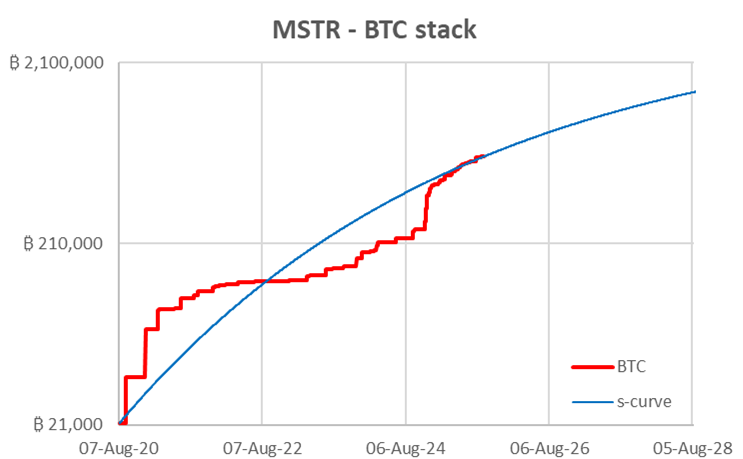
If Strategy hadn’t been so opportunistic, there would have been no explosive spike followed by a crash in BTC Yield and mNAV — but also no 638,460 BTC treasury today. That stockpile puts Strategy in an almost uncatchable long-term position.
Because BTC Yield is based on changes to the existing stack, it will be practically impossible to repeat the massive spikes in BTC Yield and mNAV seen in late 2024. Even so, once preferreds issuance ramps up and BTC begins another strong leg higher, we should see renewed uplift in Yield and mNAV.
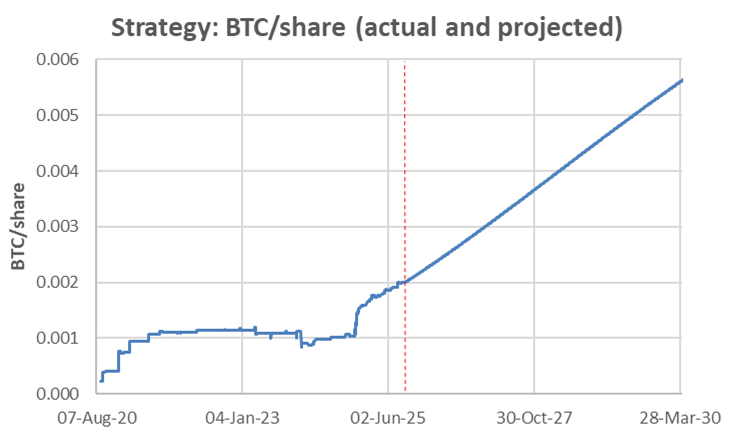
Our modelling indicates that MSTR should continue accumulating BTC at a healthy rate for the foreseeable future by tapping bond markets and short-term funding.
For longer-term investors, the key metric isn’t day-to-day mNAV, but growth in BTC per share. That figure should continue trending upward as long as Bitcoin’s price keeps climbing.
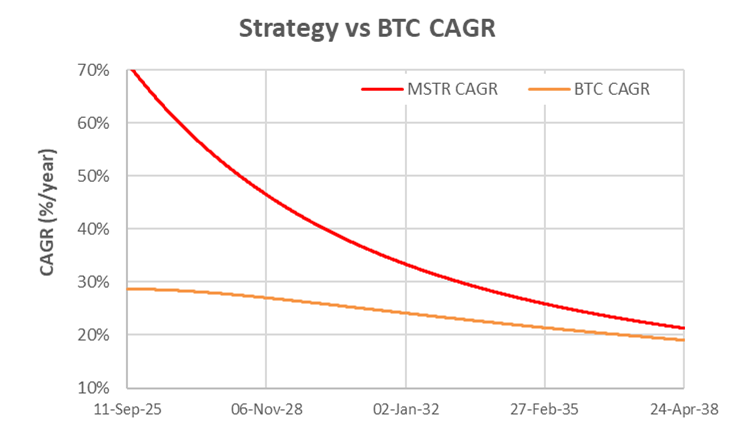
Strategy has grown up. Once viewed as the high-volatility beta play on Bitcoin, it is now — at a $108B market cap — a steadier, lower-volatility vehicle for long-term Bitcoin leverage.
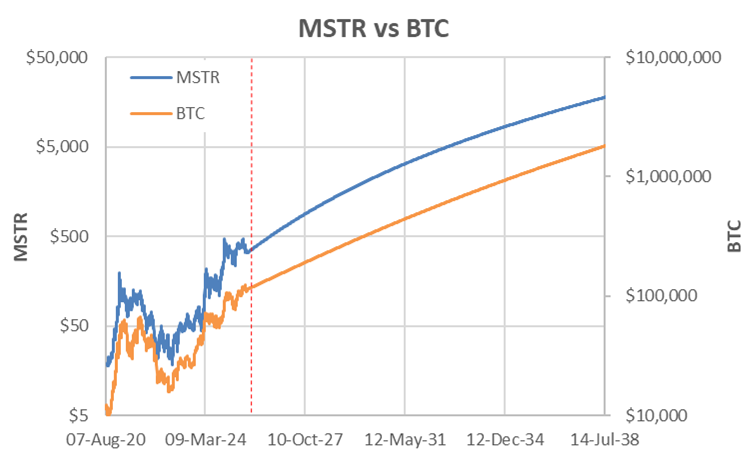
Over the next decade or two, as BTC Yield naturally decelerates, Strategy’s CAGR will likely converge from double Bitcoin’s growth rate down toward Bitcoin’s own power-law CAGR growth rate, which is likely to trend down from 30 to 20%.
BTC Momentum: The Amplifier
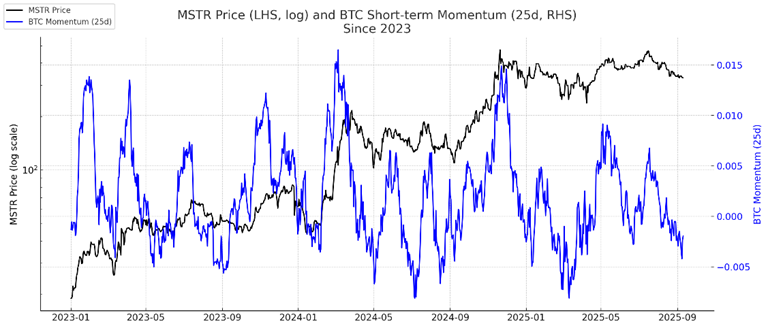
BTC Treasury Companies offer leveraged exposure to Bitcoin, but investor behaviour is cyclical: they pile in when BTC starts to rip, and sell when it peaks or dips. This sentiment cycle can be captured through momentum indicators.
Short-term (25-day) momentum: Peaks and troughs in BTC momentum closely mirror MSTR’s short-term price moves. Traders ride these bursts of energy but pull back just as quickly.
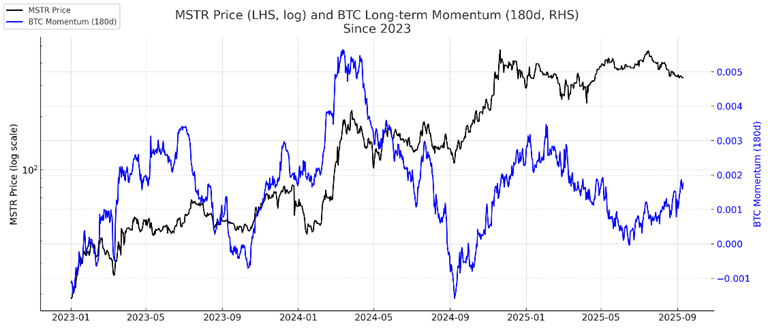
Medium-term (180-day) momentum: This aligns with longer-term cycles in MSTR, reflecting how institutional and larger investors adjust exposure to BTC-TCs in trending markets.
Momentum doesn’t replace BTC Yield, but it adds to the model and helps explain why MSTR often overshoots in both directions relative to Bitcoin itself.
The Combined Model
Bringing the signals together — BTC Yield, 25-day momentum, and 180-day momentum — produces a model that tracks MSTR’s mNAV with surprising accuracy.
· Yield provides the fundamental engine.
· Short-term momentum explains trader psychology.
· Medium-term momentum captures longer waves of capital rotation.
This three-signal framework doesn’t eliminate noise, but it offers a structured way to interpret what often looks like chaos.

Beyond Yield and Momentum: Other Factors Shaping mNAV
While BTC Yield and Bitcoin momentum explain much of the movement in mNAV, several other forces can shift valuations — especially in the short term:
· Financing Structures - Strategy’s use of convertible bonds, preferreds, and ATM programs can materially affect mNAV. In the past, we’ve seen the CB traders short MSTR heavily to bring it down on the pricing days. Currently, the market seems to be showing some caution until the preferreds gain more traction.
· Market Liquidity and Macro Conditions - Global liquidity cycles (e.g., central bank policy, interest rates, and risk-on/risk-off flows) have a direct impact on both Bitcoin’s price and investor appetite for leveraged BTC plays.
· Competitive Positioning - While Strategy currently leads with 638,460 BTC, there have been plenty of new entrants, with aggressive traders rotating to the next ‘fastest horse’. But the good news is that more institutional BTC buying drives the underlying BTC price up for MSTR investors, too.
· Investor Psychology & Narrative - mNAV is not just math — it’s also the story. At times, FUD from prominent short sellers or hype during a bull cycle can drive premiums or discounts far beyond what the simple models can predict.
Together, these factors remind us that models capture the signal, but the market often trades on the noise. For long-term investors, this makes separating structural drivers from transient shocks all the more critical.
Summary
Decomposing MSTR’s mNAV reveals a clear hierarchy of drivers.
BTC Yield remains the dominant force, while short- and medium-term BTC momentum amplify investor sentiment in cycles. The late-2024 spike in mNAV demonstrated how quickly opportunistic financing can accelerate accumulation — and how rapidly the market reprices when that pace slows.
Looking forward, Strategy’s ability to grow BTC per share, even at a steadier clip, ensures its long-term value proposition remains intact. While the era of explosive mNAV surges may be behind us, Strategy has matured into a lower-volatility leverage play on Bitcoin’s long-term trajectory.